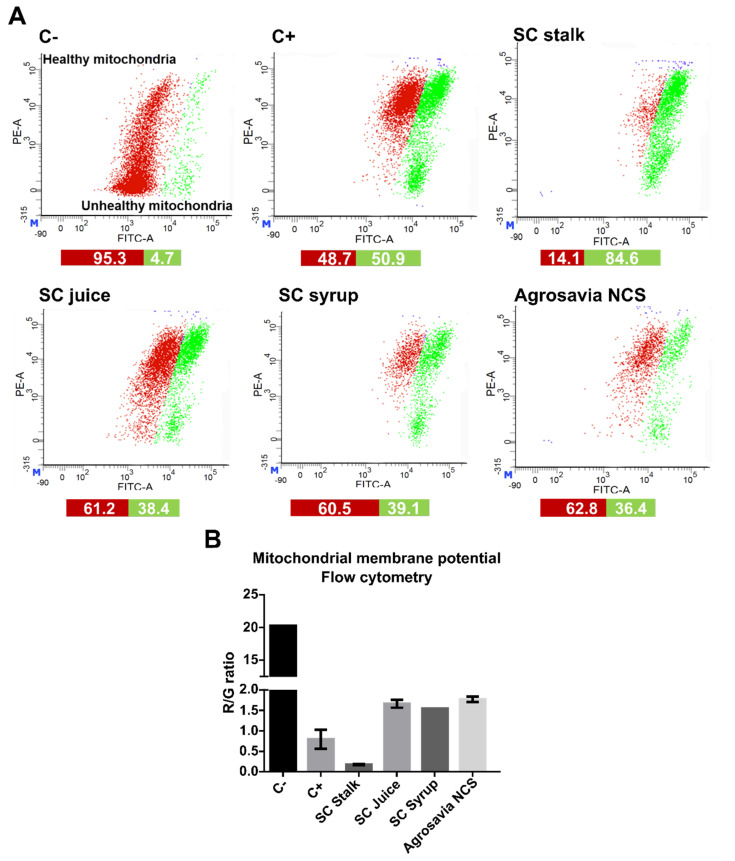
Figure 4.
Analysis of mitochondrial membrane potential by flow cytometry on the PD-induced model (SH-SY5Y neuroblastoma cells induced with rotenone) exposed to SC derivatives. Negative control (C-): cells without rotenone treatment. Positive control (C+): rotenone. (A) Flow cytometry histograms of PD-induced model labeled with the JC-1 dye after treatment with SC derivatives. (B) Quantitative red/green ratio of PD-induced model recovery upon exposure to the SC derivatives (1.59 for SC juice, 1.55 for SC syrup, and 1.72 for Agrosavia NCS), except for SC stalk (0.17).

