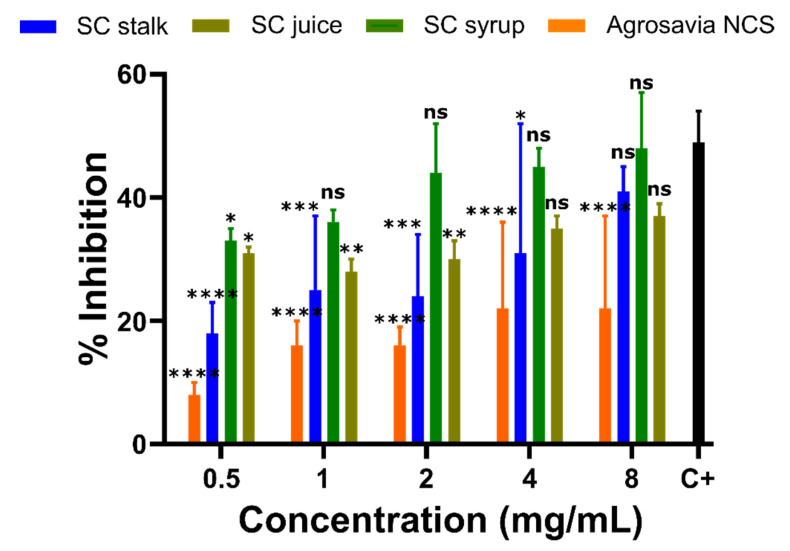
Figure 5.
Effect of SC derivatives on MAO-B activity in the PD-induced model (SH-SY5Y neuroblastoma cells). Percentage of MAO-B inhibition relative to the controls (Positive control (C+): rotenone-treated neuroblastoma cells with MAO-B inhibitor pargyline and negative control (C-): rotenone-treated neuroblastoma cells with the reaction buffer (inhibition of 0%)). The values in each column represent the mean ± standard error of the mean (SEM) of three independent experiments. Statistical analysis was performed by comparing the different treatments to the positive control. (*) corresponds to statistically significant difference with a p-value in the range of 0.01 ≤ p-value ≤ 0.05, (**) to p-value in the range of 0.001 ≤ p-value < 0.01, (***) to p-value in the range of 0.0001 ≤ p-value ≤ 0.001, and finally (****) to p-value < 0.0001. ns is for treatments where no statistically significant differences were found.

