Figure 6.
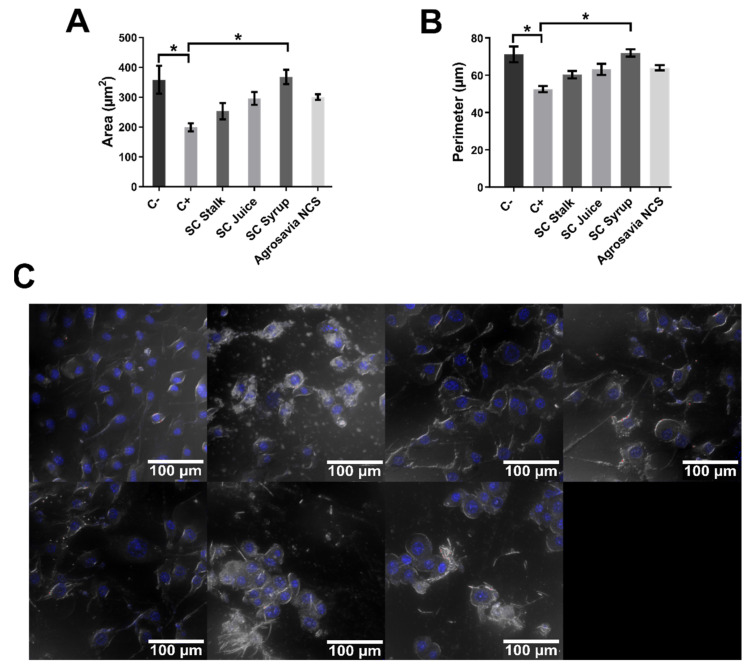
Analysis of morphological changes in PD-induced model nuclei stained with Hoechst dye. Negative control (C-): cells without rotenone treatment. Positive control (C+): rotenone. Quantitative analysis of area and perimeter of cell nuclei was performed over the images presented in Figure 3A. (A) Area of cell nuclei exposed to different treatments. The smallest area was obtained for the nuclei of cells exposed to rotenone (198.963 ± 13.845 µm2). The largest area was obtained for the control treatment (358.243 ± 46.879 µm2). A significant decrease in the nuclear area of the rotenone treatment is observed compared to the control and the SC syrup treatment. (B) Perimeter of cell nuclei exposed to different treatments. The smallest perimeter was obtained for the nuclei of cells exposed to rotenone (52.525 ± 1.629 µm). The largest perimeter was obtained for the control treatment (71.202 ± 4.249 µm). A significant decrease in the nuclear perimeter of the rotenone treatment is observed compared to the control and the SC syrup treatment. (C) SH-SY5Y neuroblastoma cells treated with rotenone 150 μM for 24 h and exposed to Hoechst dye. Images show that rotenone induced nuclear fragmentation. All the images correspond to the analysis of SH-SY5Y cells after exposure to rotenone (24 h) in the absence of treatments with SC derivatives. Two-way ANOVA test was used to assess statistical significances * (p-value ≤ 0.05).

