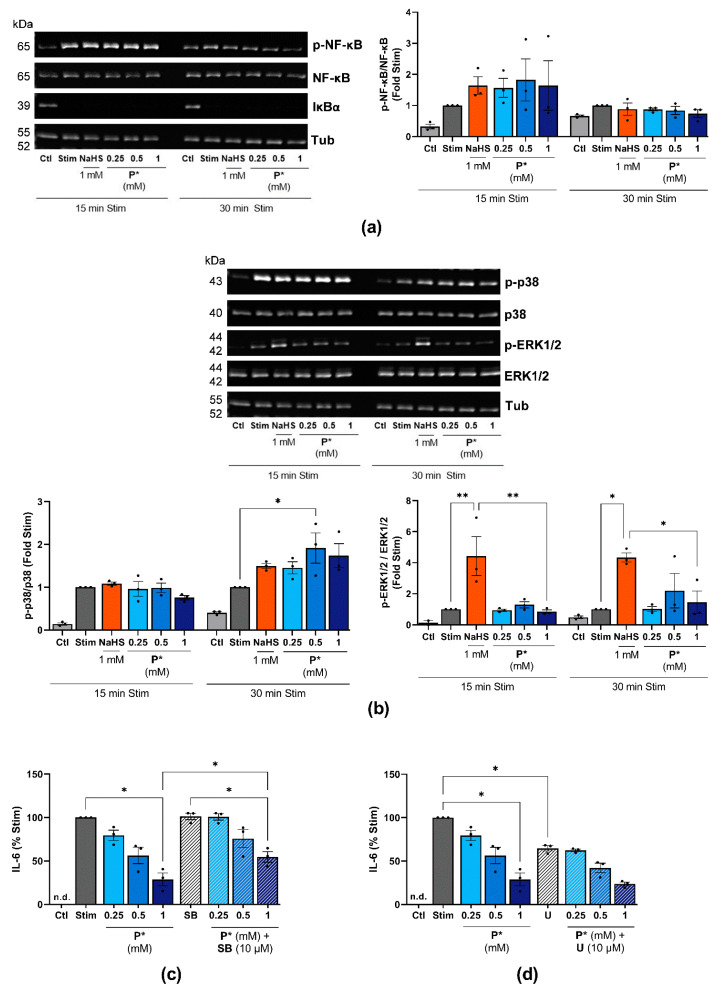
Figure 9.
Influence of P* on NF-κB and MAPK signaling pathways. Ctl = untreated cells, n.d. = non-detected. (a,b) ATDC5 cells were incubated with NaHS or P* for 1 h and stimulated with IL-1β/IFN-γ for 15 or 30 min. Representative Western blots of (a) p-NF-κB, NF-κB, IκBα, and α, β-tubulin (Tub), or (b) p-p38, p38 MAPK, p-ERK1/2, ERK1/2, and Tub expression. Densitometry analysis values were normalized against (a) Tub or (b) the equivalent unphosphorylated protein, respectively, and then compared with stimulated cells (Stim) set to 1, n = 3. p-values for all concentrations are shown, * p < 0.05, ** p < 0.01. (c,d) ATDC5 cells were treated with (c)10 µM SB203580 (SB) or (d) 10 µM U0126 (U) for 1 h and subsequently with the indicated concentrations of P* for 6 h. The medium was exchanged, and the cells were stimulated for 24 h with IL-1β/IFN-γ. IL-6 levels were assessed by ELISA and normalized to Stim (100%), n = 3, * p < 0.05.

