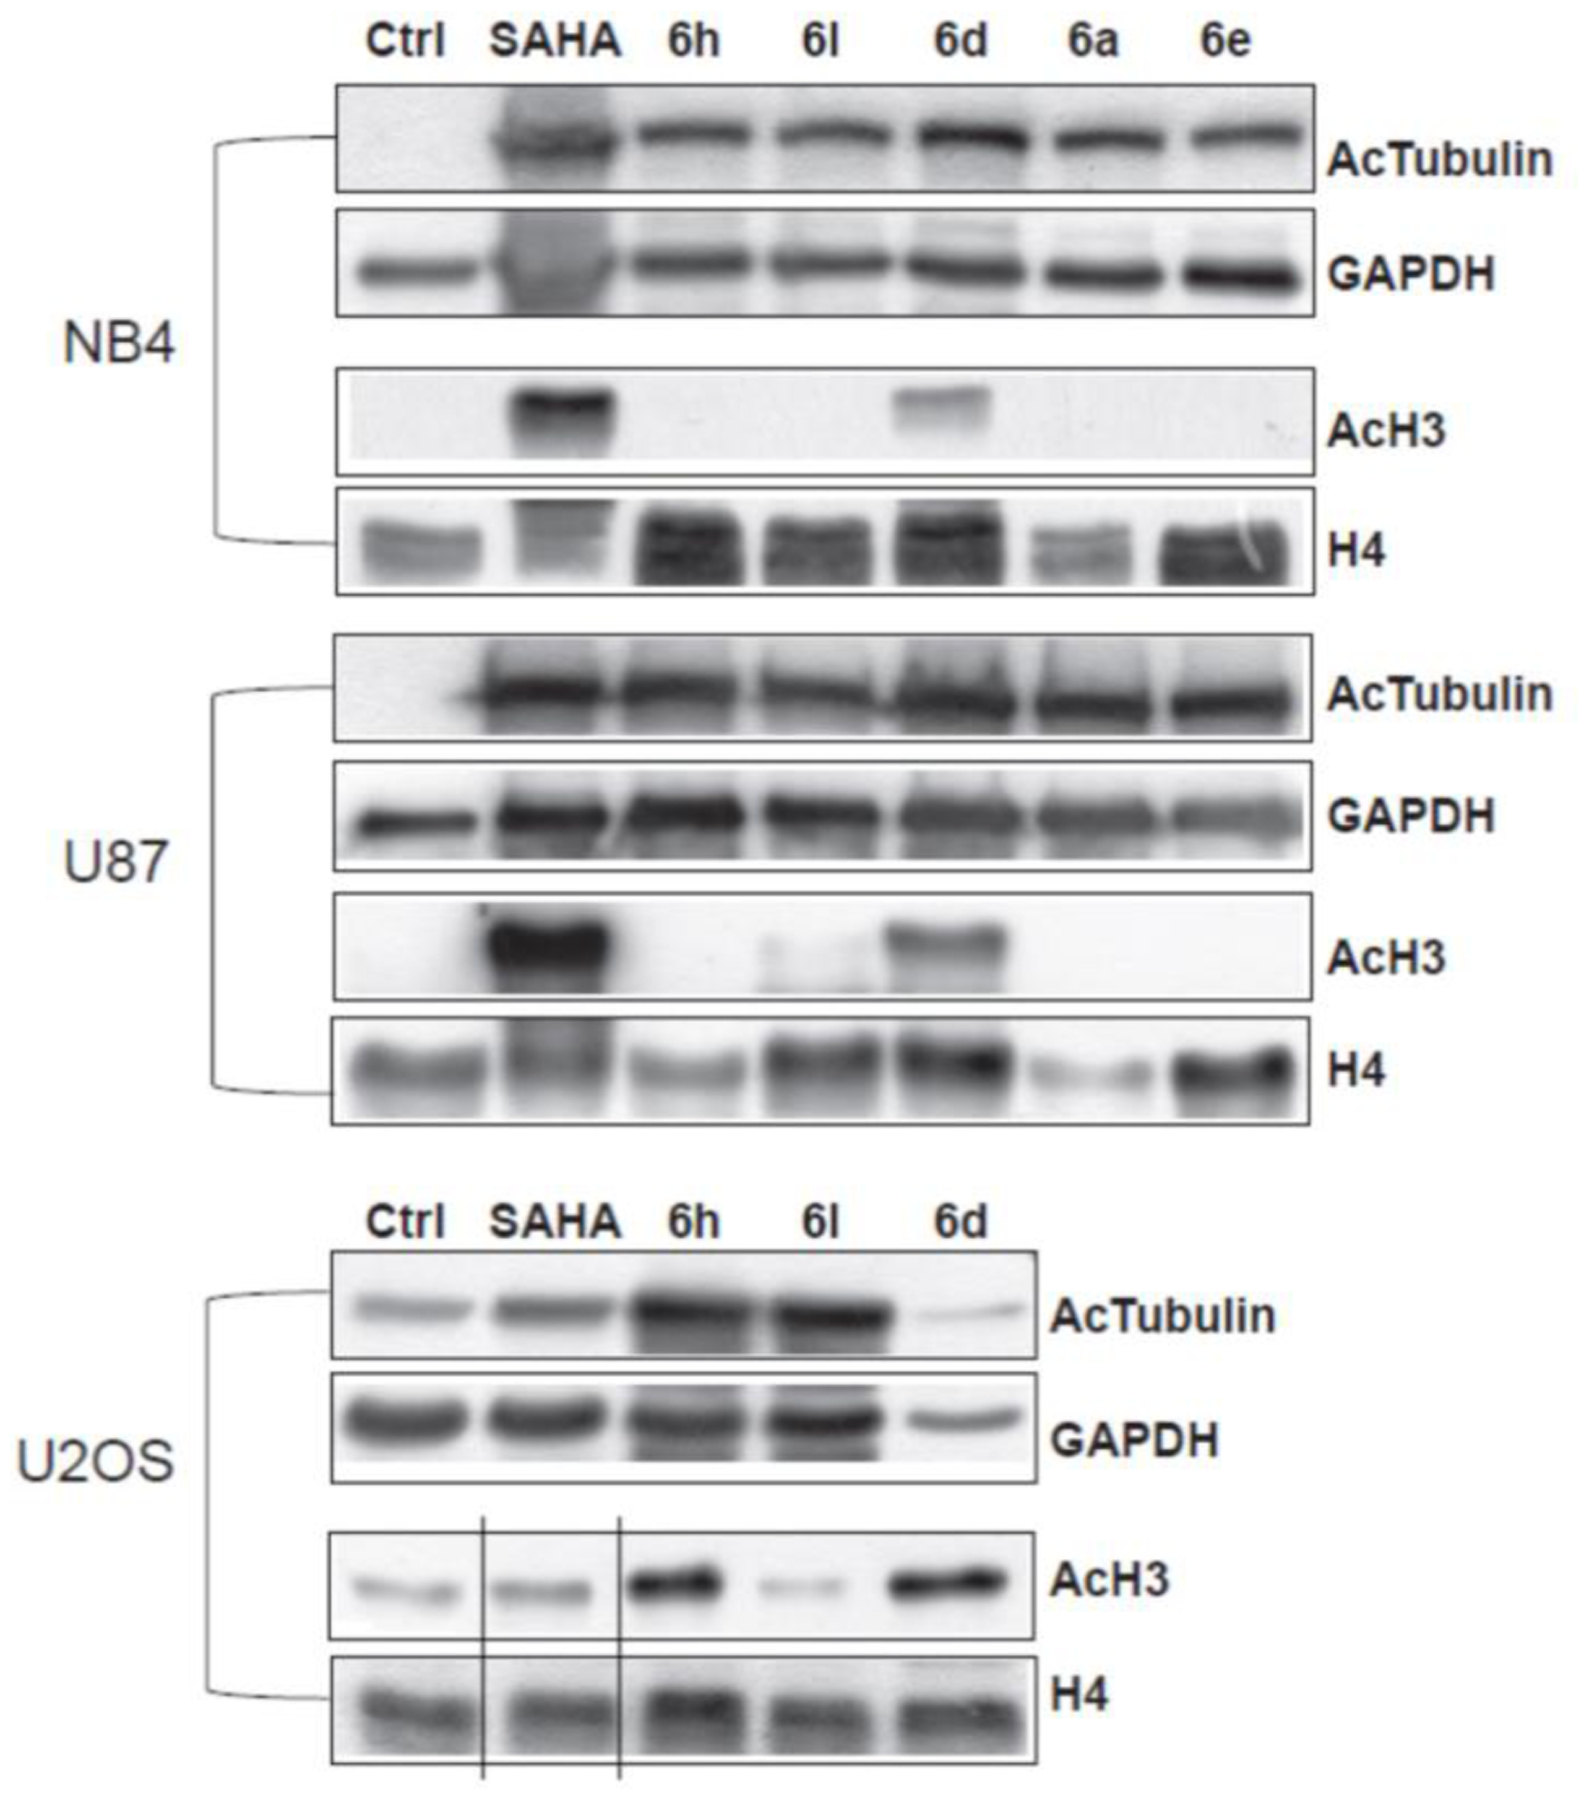
Figure 6. Western blot experiments to evaluate HDAC6 selectivity over HDAC1.

Acetylation levels of the α-tubulin (AcTub) and histone H3 in NB4, U87 and U2OS cell lines treated with the compounds 6a, 6d, 6e, 6h, and 6l at 5 μM for 30 h. SAHA was used as a positive control at the same time and concentration. GAPDH and H4 were used as loading controls.
