. Author manuscript; available in PMC: 2022 Jul 22.
Published in final edited form as: J Med Chem. 2021 Jul 12;64(14):9960–9988. doi: 10.1021/acs.jmedchem.1c00184

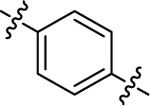
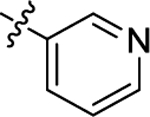
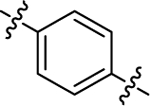
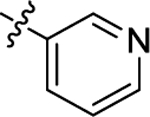
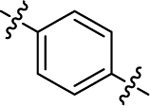
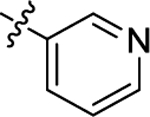
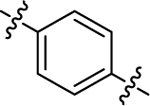
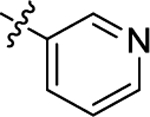
Table 1.

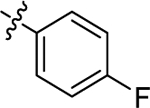
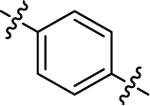
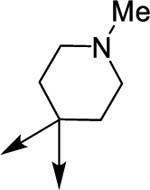
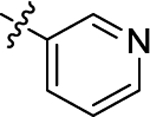
Inhibitory activity of compounds 6a-m towards hHDAC1 and hHDAC6 (as IC50, nM)a.
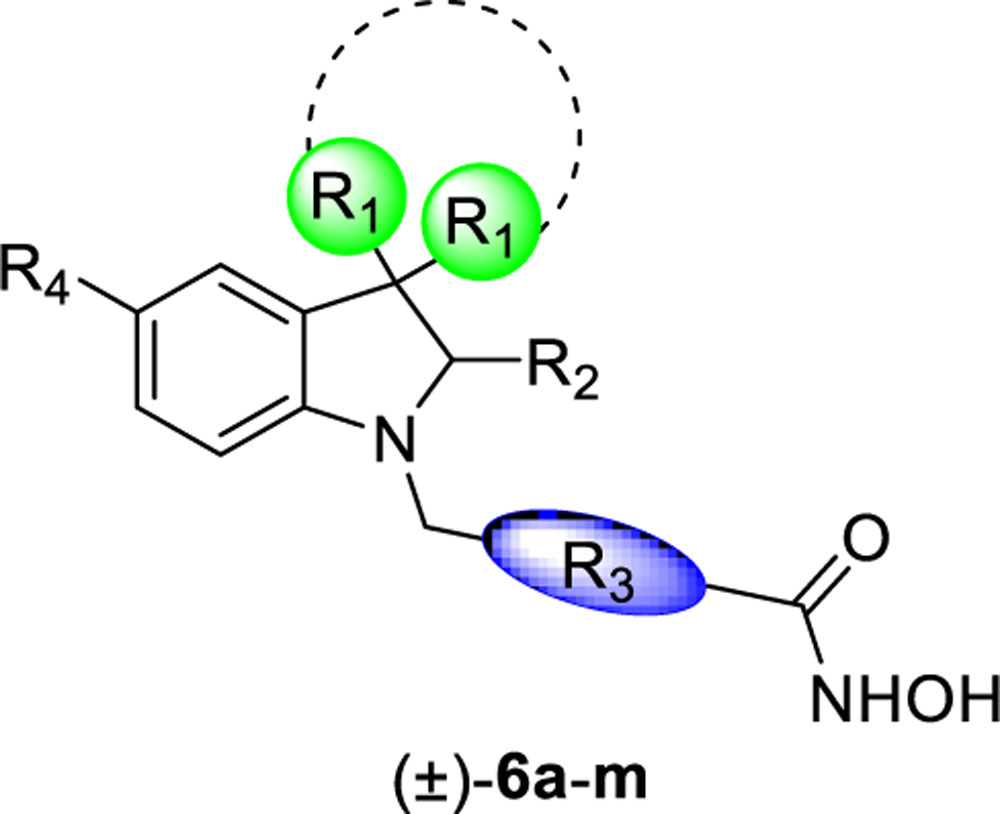
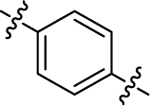
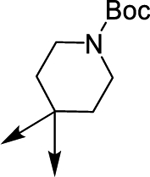
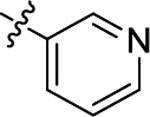
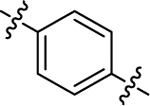
graphic file with name nihms-1723853-t0002.jpg
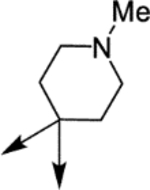
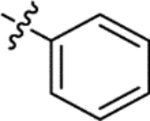
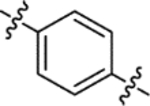
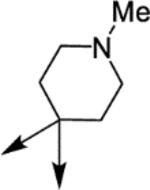
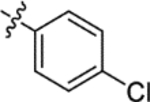
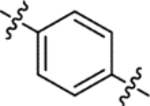
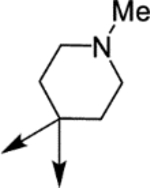
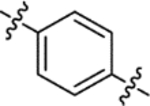
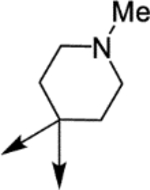
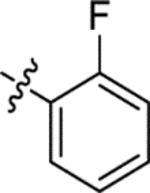
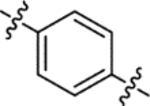
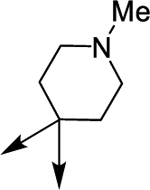
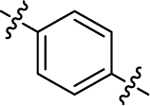
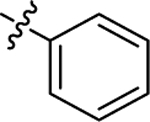
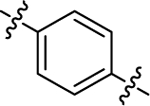
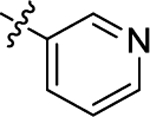
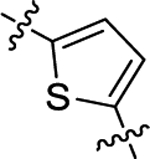
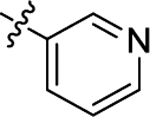
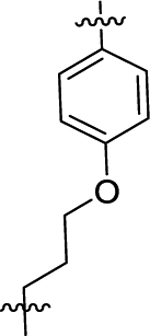
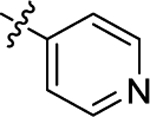
Compound R1 R2 R3 R4 hHDAC1 (IC50 nM) hHDAC6 (IC50 nM) HDAC1/6
(±)-6a graphic file with name nihms-1723853-t0003.jpg graphic file with name nihms-1723853-t0004.jpg graphic file with name nihms-1723853-t0005.jpg H 4290 73.2 ± 11.6 59
(±)-6b graphic file with name nihms-1723853-t0006.jpg graphic file with name nihms-1723853-t0007.jpg graphic file with name nihms-1723853-t0008.jpg H 3650 164.8 ± 30.7 22
(±)-6c graphic file with name nihms-1723853-t0009.jpg graphic file with name nihms-1723853-t0010.jpg graphic file with name nihms-1723853-t0011.jpg H 8100 110.6 ± 15.5 73
(±)-6d graphic file with name nihms-1723853-t0012.jpg graphic file with name nihms-1723853-t0013.jpg graphic file with name nihms-1723853-t0014.jpg H 4850 28.5 ± 3.8 170
(±)-6e graphic file with name nihms-1723853-t0015.jpg graphic file with name nihms-1723853-t0016.jpg graphic file with name nihms-1723853-t0017.jpg H 6160 141.9 ± 38.6 43
(±)-6f graphic file with name nihms-1723853-t0018.jpg graphic file with name nihms-1723853-t0019.jpg graphic file with name nihms-1723853-t0020.jpg H 7600 111.7 ± 19.4 68
(±)-6g Me graphic file with name nihms-1723853-t0021.jpg graphic file with name nihms-1723853-t0022.jpg H 18680 166.2 ± 31.3 112
(±)-6h Me graphic file with name nihms-1723853-t0023.jpg graphic file with name nihms-1723853-t0024.jpg H 5330 41.9 ± 6.0 127
(R)-(+)-6h Me graphic file with name nihms-1723853-t0025.jpg graphic file with name nihms-1723853-t0026.jpg H 16190 90.6 ± 15.5 178
(S)-(−)-6h Me graphic file with name nihms-1723853-t0027.jpg graphic file with name nihms-1723853-t0028.jpg H 3380 71.3 ± 8.4 47
(±)-6i Me graphic file with name nihms-1723853-t0029.jpg graphic file with name nihms-1723853-t0030.jpg OMe 5320 67.2 ± 15.3 79
(±)-6j Me graphic file with name nihms-1723853-t0031.jpg graphic file with name nihms-1723853-t0032.jpg H 6320 810.8 ± 59.6 8
(±)-6k Me graphic file with name nihms-1723853-t0033.jpg graphic file with name nihms-1723853-t0034.jpg H 1630 616.3 ± 40.7 3
(±)-61 Me graphic file with name nihms-1723853-t0035.jpg graphic file with name nihms-1723853-t0036.jpg H 10790 61.1 ± 12.9 177
(±)-6m graphic file with name nihms-1723853-t0037.jpg graphic file with name nihms-1723853-t0038.jpg graphic file with name nihms-1723853-t0039.jpg H 8100 151.6 ± 26.4 53
Tubacin, 37 - - - - 1400 4 350
SAHA, 47 - - - - 33 33 1
a

Each value is the mean of at least three determinations; results are expressed with ±SD. When not specified, SD is <10% of the IC50.