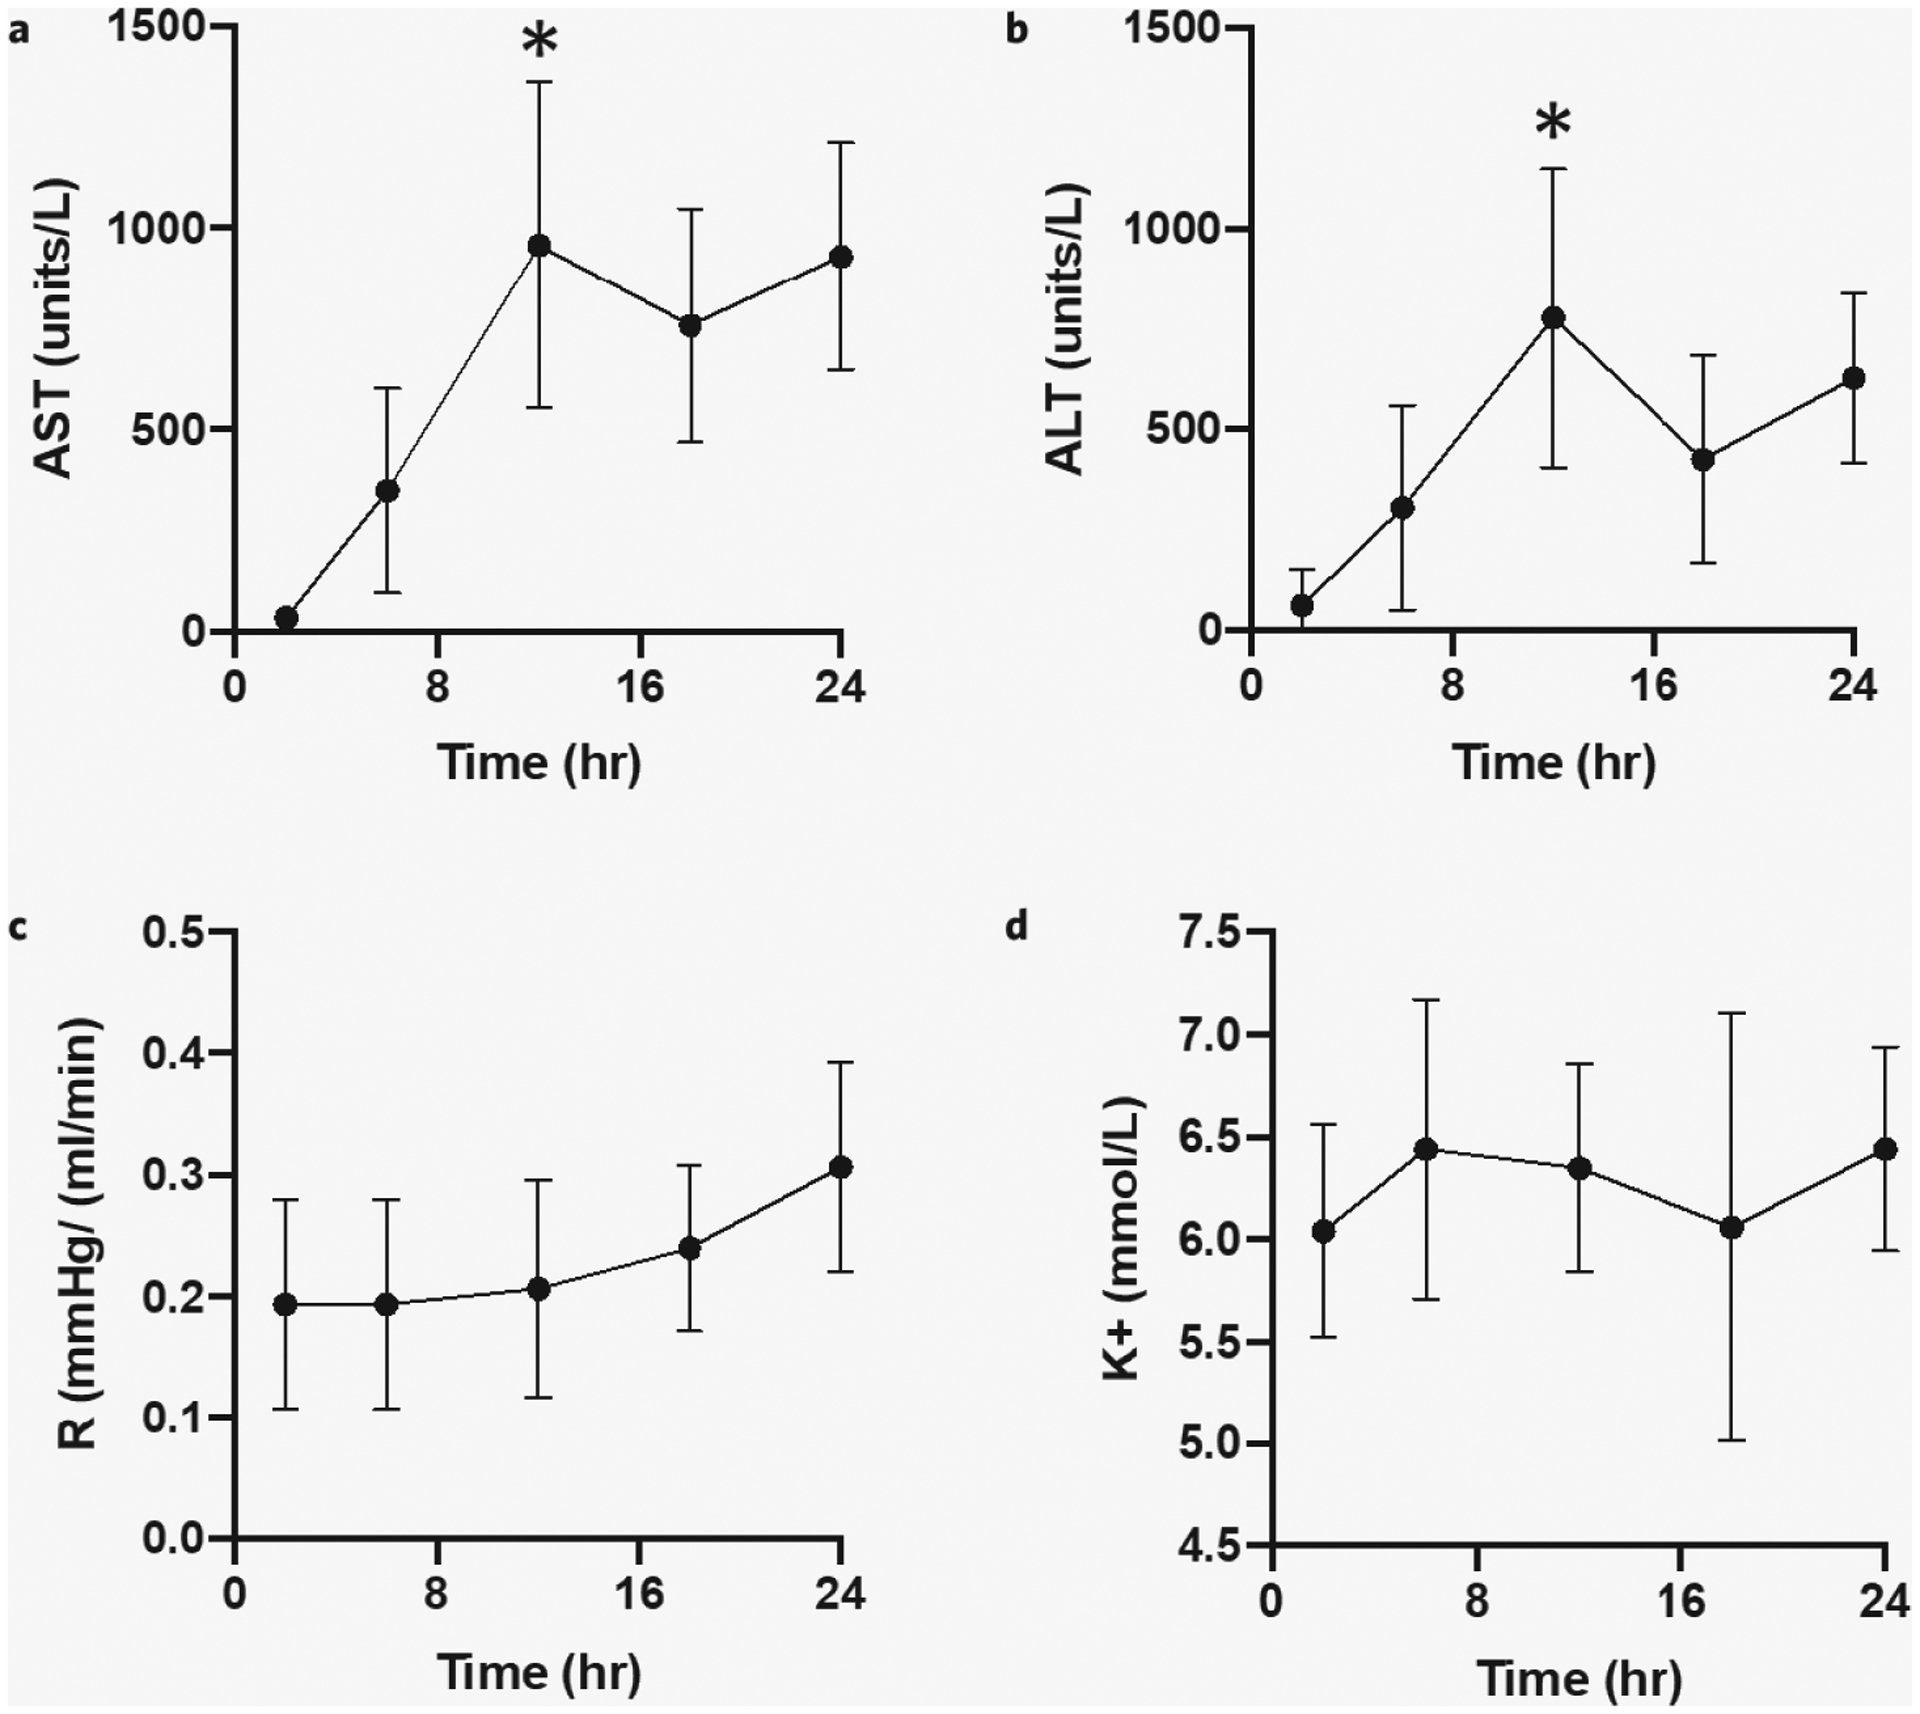
Figure 3.

24-hour rat liver NMP injury indicators. Compared to the 6-hour baseline (a) AST levels were significantly increased at 12 hours (p value 0.029); (b) ALT levels were significantly increased at 12 hours (p value 0.050); (c) resistance (pressure over flow rate) increase over 24 hours but did not reach statistical significance at 12, 18, and 24 hours (p value 0.098); and (d) potassium levels were stable over 24 hours (p value 0.434). Error bars represent standard deviations. *significant difference, p < 0.05.
