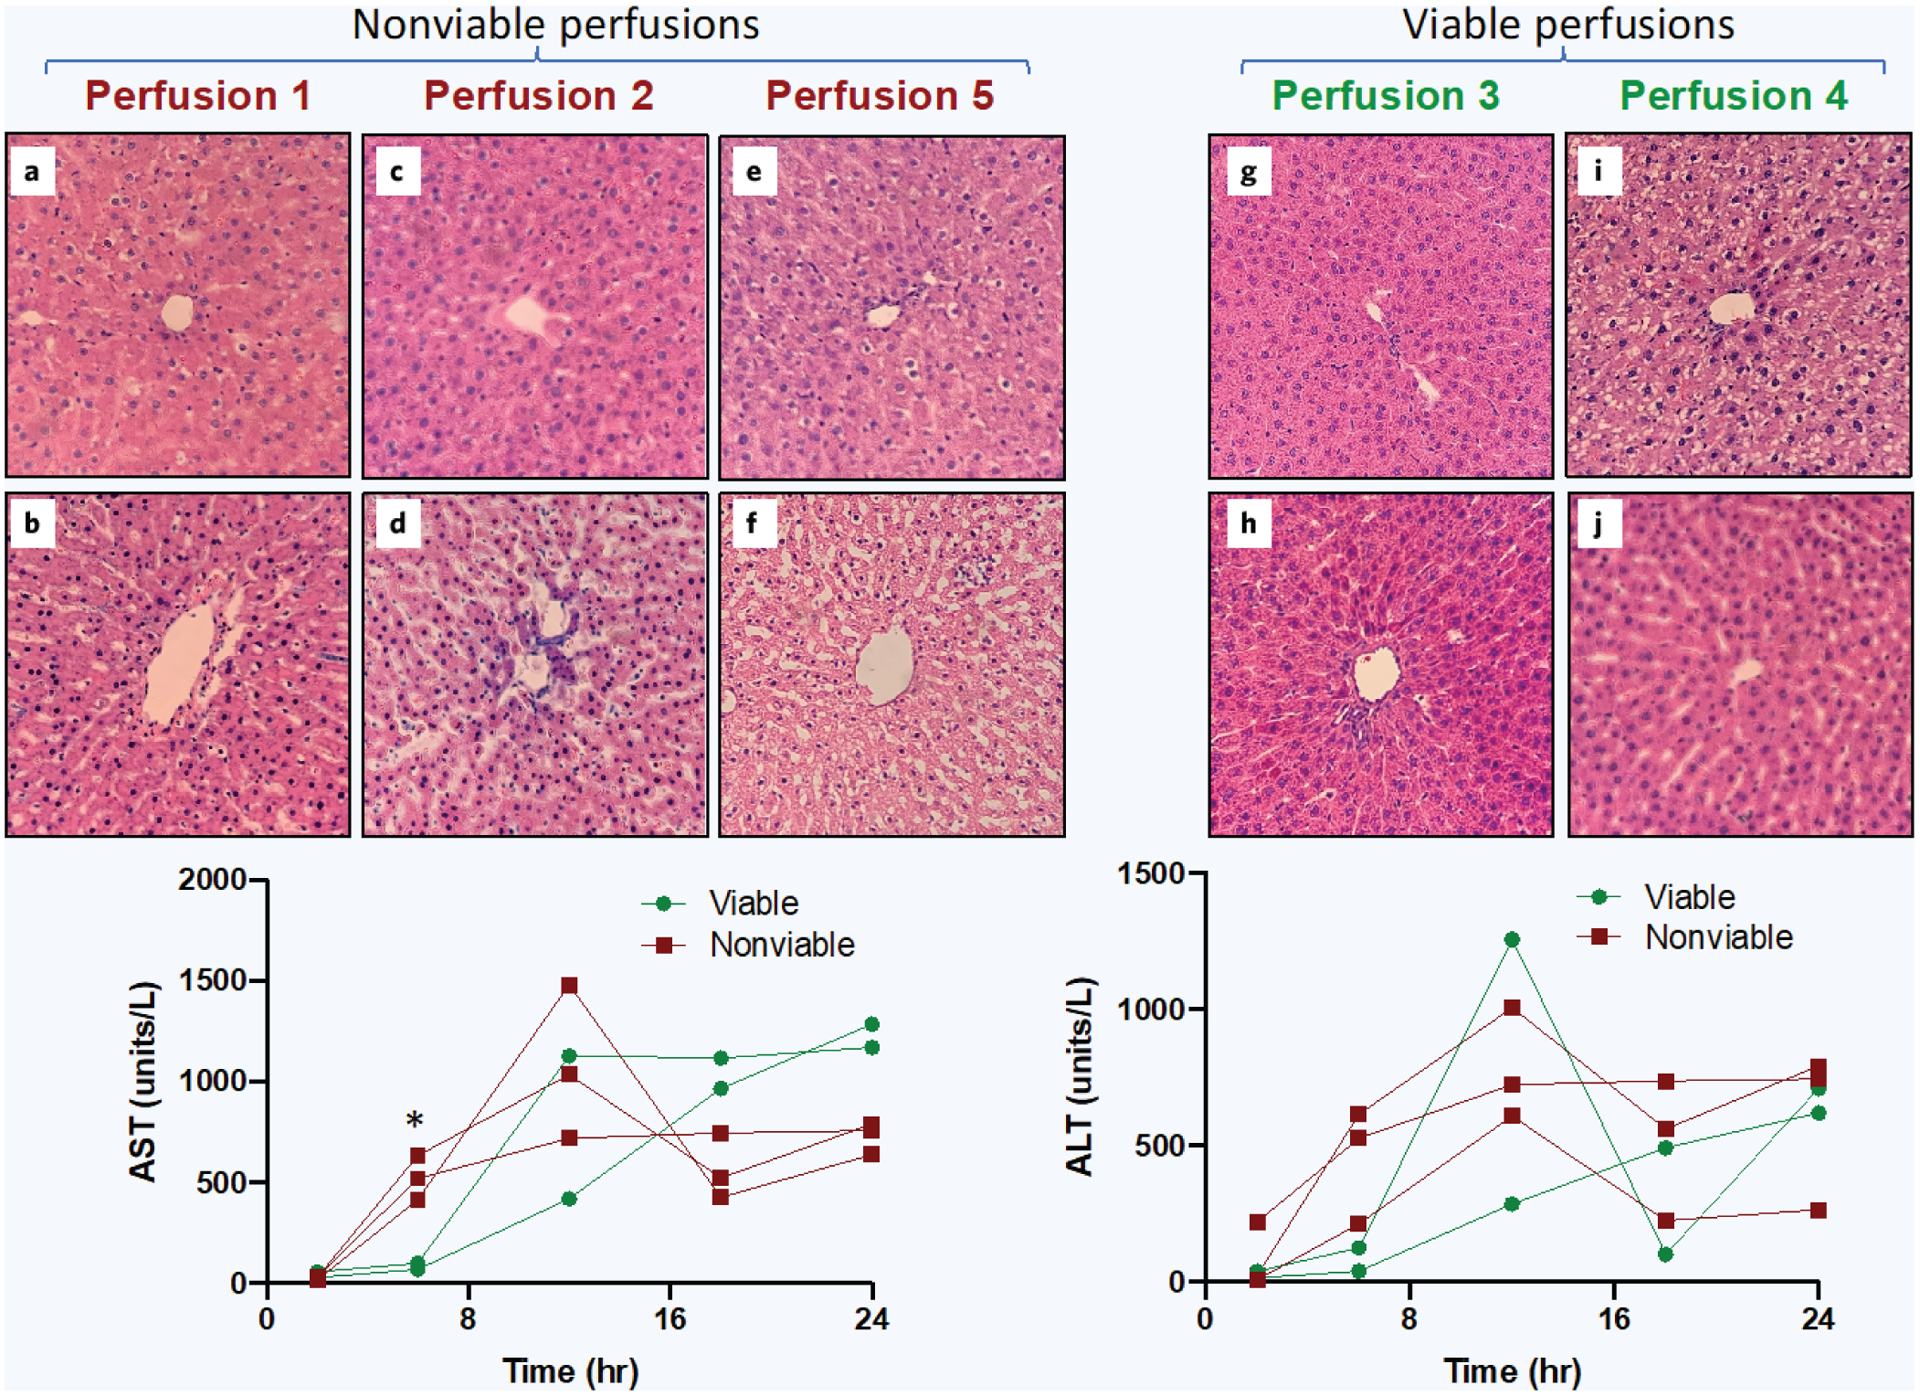
Figure 5.

20× H&E staining of rat liver parenchyma before and after 24-hour normothermic machine perfusion with corresponding AST/ALT levels between viable and nonviable perfusions. a, c, e, g, and i show H&E at T = 0 hours (before perfusion). b, d, f, h, and j show the corresponding liver grafts H&E at T = 24 hours (after perfusion). Blinded histology revealed perfusions 1, 2, and 5 were nonviable and perfusions 3 and 4 were viable. Perfusion metrics revealed a statistically significant difference in 6-hour AST levels between viable and nonviable groups (p value 0.013), *significant difference, p < 0.05.
