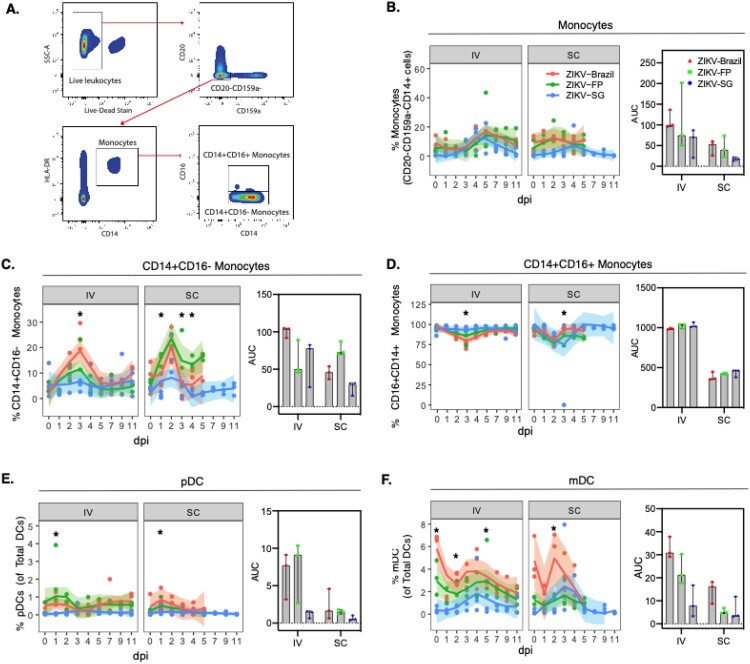
Figure 5.
Monocytes and dendritic cells in the blood following ZIKV infection. A) The gating strategy of monocytes and dendritic cells, B) frequency and AUC of monocytic cells (CD20-CD159a-HLA-DR + CD14+), C-D) monocytic cell subsets (CD14+CD16- monocytes and CD14+CD16+ monocytes), E) plasmacytoid DCs (pDC) and F) myeloid DCs (mDC) were assessed in PBMCs. Data for time points 7, 9 and 11 dpi following SC infection with ZIKV-Brazil and ZIKV-FP is unavailable, therefore for SC AUC was only computed for the time period days 0–5. Curves of immune cell percentages over time were drawn using Loess smoothing with 95% CI of the smoothed curve represented in grey. AUC were graphed as median and inter-quartile range (IQR). Two-way ANOVA adjusted for Turkey’s multiple comparison (*p<0.05) was conducted at each timepoint, and Wilcoxon tests between groups for AUC (*p<0.05).

