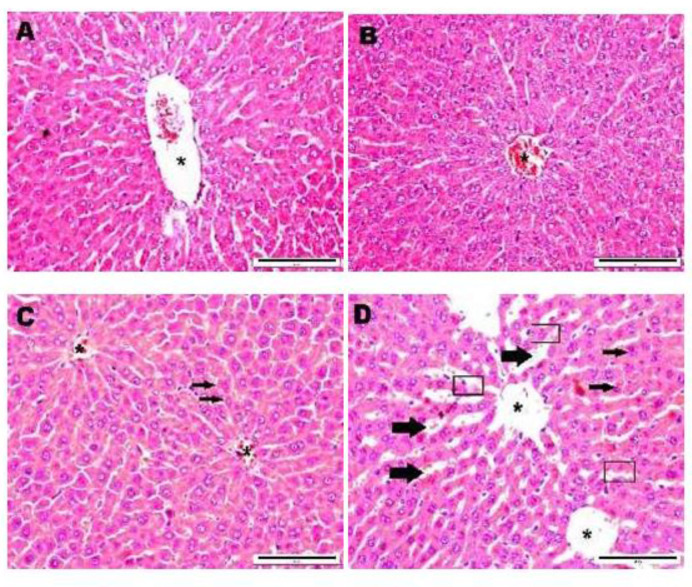
Figure 1.
Photomicrograph showing the histological sections of liver tissue of male rats (20x magnification). (A) Group 1 (control-DW), (B) Group 2 (MESP 400 mg/kg), (C) Group 3 (MESP 1000 mg/kg), (D) Group 4 (MESP 2000 mg/kg) (*: Central vein; □: Denudation of epithelial lining; → : Hepatocyte degeneration; ➡ : Sinusoidal dilatation)

