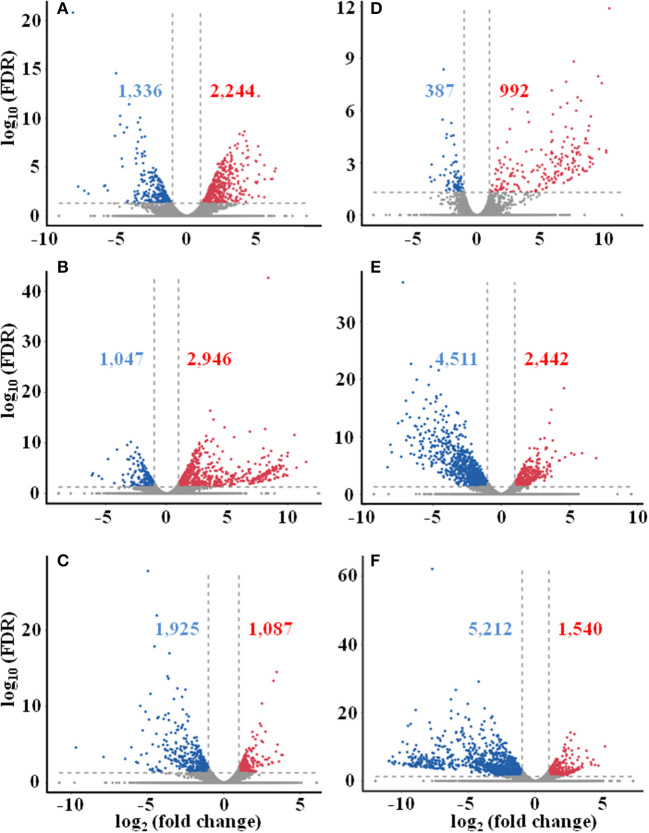
Figure 4.
Distribution of differentially expressed unigenes in different seasonal FD-TRs in T. hemsleyanum using Volcano plot. (A) Su vs. Sp, (B) Au vs. Sp, (C) Wi vs. Sp, (D) Au vs. Su, (E) Wi vs. Su, and (F) Wi vs. Au. Red numbers and dots represent upregulated unigenes, blue number and dots represent downregulated unigenes, and gray dots represent unigenes with no change between comparing pairs. Sp, spring; Su, summer; Au, autumn; Wi, winter.

