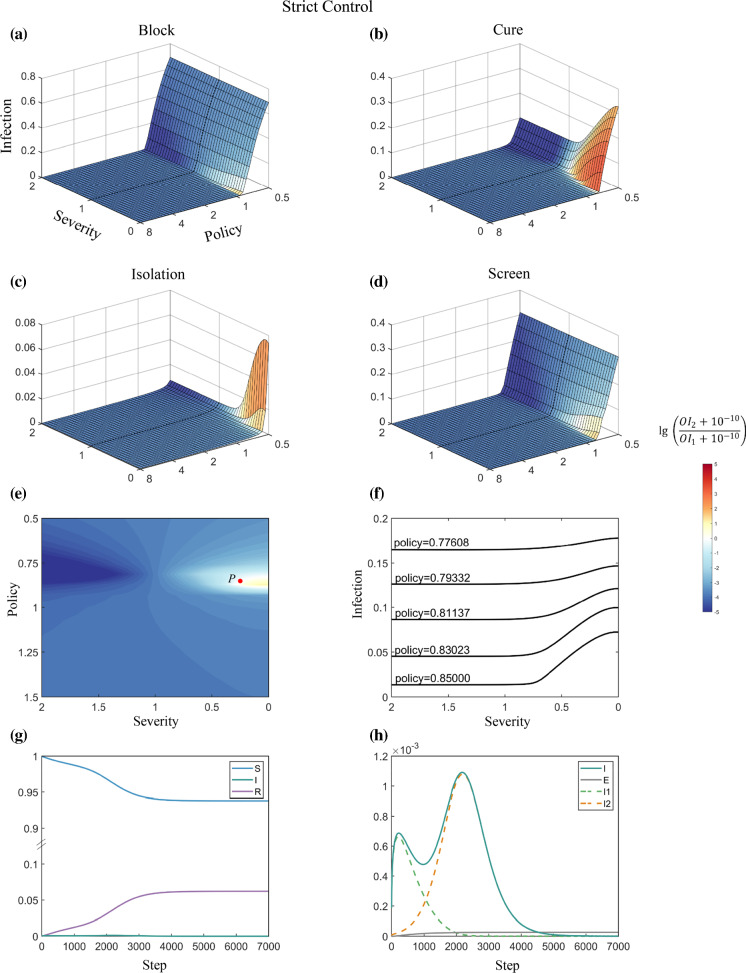
Fig. 2.
Competition between virus strains with different severities under Strict Control. For a–d, the x-axis represents the severity of the emerging strain relative to that of the original strain, which is set to 1. A value < 1 means that the severity of the emerging strain is lower than that of the original strain and vice versa. The y-axis represents policy strengths, which is the factor used to multiply (or divide) the specific parameters related to the four respective policies in the coSIR model (for policy-related parameters, see Methods and Table S2). The z-axis represents the overall infection rate among the whole population. The colour bar represents the log ratio of the number of overall infections (OI) of the emerging strain to that of the original strain. A positive number means that the emerging strain outcompetes the original strain in terms of the number of infections. e, the 2-dimensional top view of a, showing that a milder emerging strain can surpass the original strain in the number of infections under suitable conditions. f, impact of severity on the overall infection rate under various strengths of the Block policy. g and h, details of the epidemic dynamics for the two competing strains of point P in a

