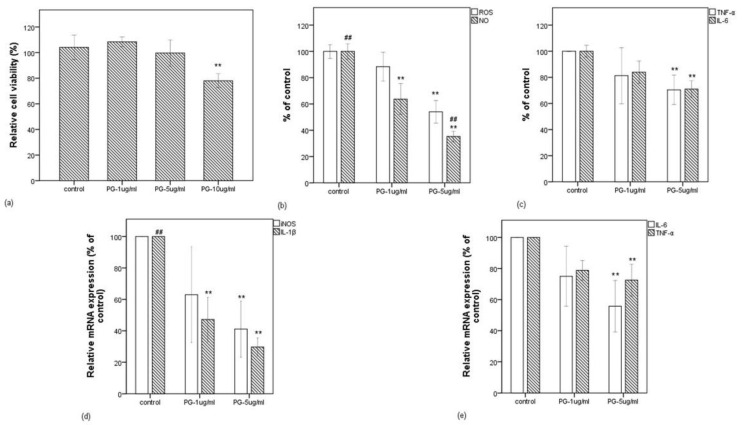
Figure 5.
Effect of pyrogallol on LPS-induced RAW 264.7 cells. (a) Relative cell viability when RAW 264.7 cells were treated with LPS in the presence of pyrogallol at 1, 5, and 10 µg/mL. (b) Effect of pyrogallol at 1 and 5 µg/mL in intracellular ROS and NO release levels (in % of control) in LPS-stimulated RAW 264.7 cells. (c) Effect of pyrogallol at 1 and 5 µg/mL in IL-6 and TNF-α release levels (in % of control) in LPS-stimulated RAW 264.7 cells. (d) Effect of pyrogallol at 1 and 5 µg/mL in mRNA expressions of iNOS and IL-1β (in % of control) in LPS-stimulated RAW 264.7 cells. (e) Effect of pyrogallol at 1 and 5 µg/mL in mRNA expressions of IL-6 and TNF-α (in % of control) in LPS-stimulated RAW 264.7 cells. Data are expressed as the mean value of at least triplicate experiments. Error bars represent +/− standard deviation. ** p < 0.01 versus control, ## p < 0.01 versus PG-1 µg/mL. PG: pyrogallol.

