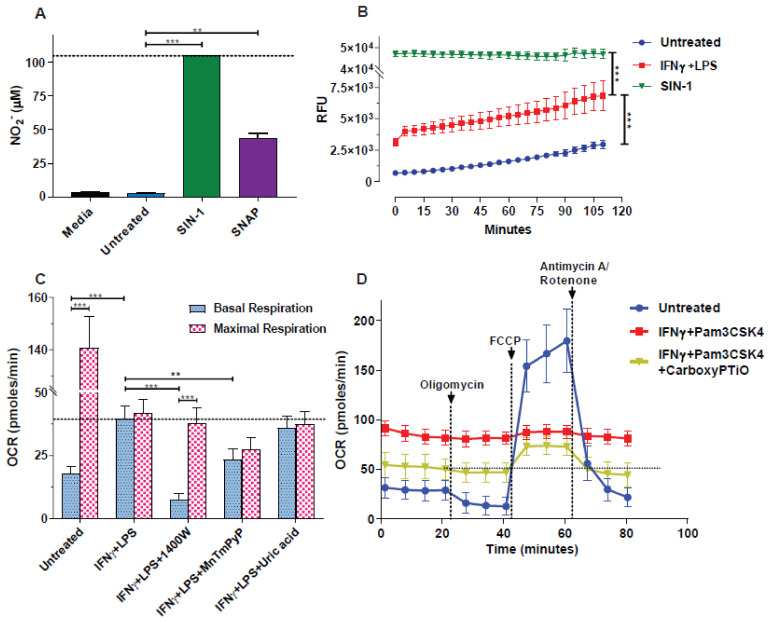
Figure 2.
Quantification of macrophage- or donor-derived NO●, and the partial cell-respiration rescue by NO● and O2●− blockade. (A,B) Macrophages were activated for 24 h with IFNγ (40 ng/mL) plus LPS (10 ng/mL) or not (untreated) and cell supernatants were analyzed for (A) nitrites (NO2¯), using the Griess assay. NO2¯ levels were expressed as μΜ using serial dilutions of NaNO2 for the standard curve. Cell-free media, similar to the one used for background subtraction in Seahorse served as an additional control. (B) For the DAF-FM assay, serial fluorescent measurements of active NO● were taken every 5 min in a Seahorse mirror plate. Values in media from cell-free wells (blank), were subtracted. (A,B) In both cases the reactive species-donors SNAP (3 mM) and/or SIN-1 (3 mM) were added to cell-free wells prior to the respective assays. The Kruskal-Wallis test (with the Benjamini-Krieger-Yekutieli two-stage linear step-up, or with the Dunn’s, procedure) was used for comparisons. ** p < 0.01, *** p < 0.001. (C,D) The ROS/RNS inhibitors/scavengers 1400 W (50 μΜ), MnTmPyP (15 μΜ), uric acid (250 μΜ) or carboxyPTiO (100 μΜ) were used as indicated to treat macrophages for 1 h prior to activation with (C) IFNγ + LPS (40 ng/mL and 10 ng/mL respectively) or (D) IFNγ + Pam3CSK4 (40 ng/mL and 100 ng/mL respectively). (C) The last OCR measurements in sequence before addition of oligomycin or after addition of FCCP were used to represent the basal respiration, while the highest point was used for the representation of the maximal respiration. Two-tailed Mann-Whitney U tests or the Kruskal-Wallis test (with the Benjamini-Krieger-Yekutieli two-stage linear step-up procedure) were used for comparisons. ** p < 0.01, *** p < 0.001. (A) Horizontal intermittent lines indicate either the measured nitrites levels of SIN-1 (assay’s plateau), (C) the basal OCR levels of IFNγ + LPS activated macrophages or (D) macrophages treated with IFNγ + Pam3CSK4 + CarboxyPTiO. Vertical intermittent lines indicate the injection points. One representative experiment is shown, with data presented as mean ± STD of at least three replicates per condition.

