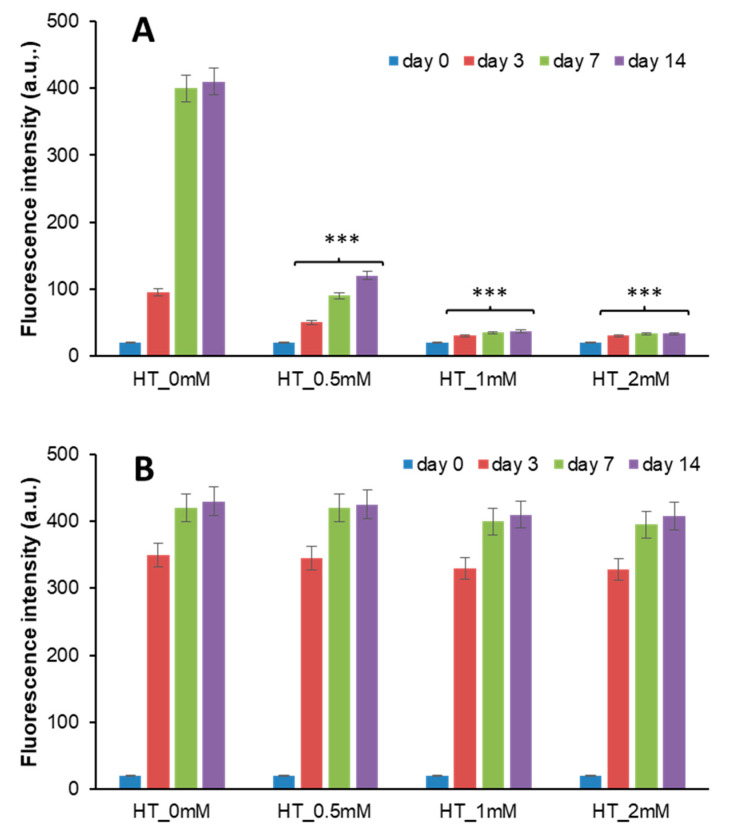
Figure 2.
Effect of HT on insulin glycation kinetics. Insulin samples were incubated at 37 °C with 0.5 M d-ribose (A) and 1 mM methylglyoxal (B) at different concentrations of HT (0–2 mM) and AGE fluorescence (λex 320 nm/λem 410 nm) was monitored at different time points. Other experimental details are described in the Methods section. *** p ˂ 0.001 versus sample in the absence of HT (HT_0 mM).

