Figure 1.
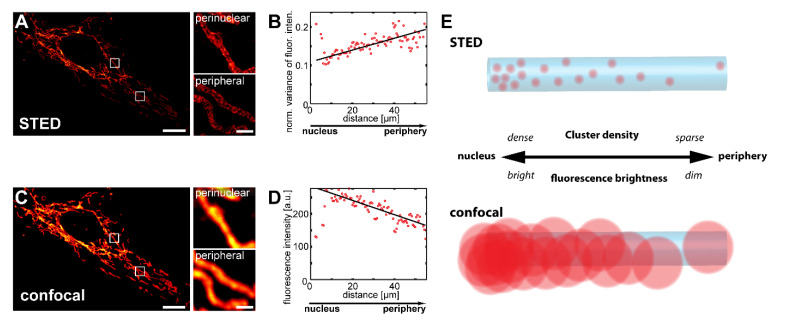
Tom20 forms an inner-cellular abundance gradient, which can be detected with confocal microscopy. (A–D) STED super-resolution and diffraction-limited confocal microscopy reveal inner-cellular Tom20 abundance gradients. Vero cells were decorated with antiserum against Tom20 and imaged by STED (A) or confocal (C) microscopy. Small images are magnifications of perinuclear or peripheral mitochondria, as indicated by rectangles in the corresponding overview images. Analysis of inner-cellular Tom20 abundance gradients using the STED (B) and the confocal (D) image data. Plotted are the averaged normalized local variance values of the fluorescence intensity (B) or the averaged fluorescence intensity values (D), each from the center of the cell, as shown in (A,C), to its periphery. Schematic showing the effect of abundance gradients of mitochondrial proteins on the appearance in images recorded with STED and confocal microscopy (E). Scale bars: 1 µm (magnifications), 10 µm (overviews).

