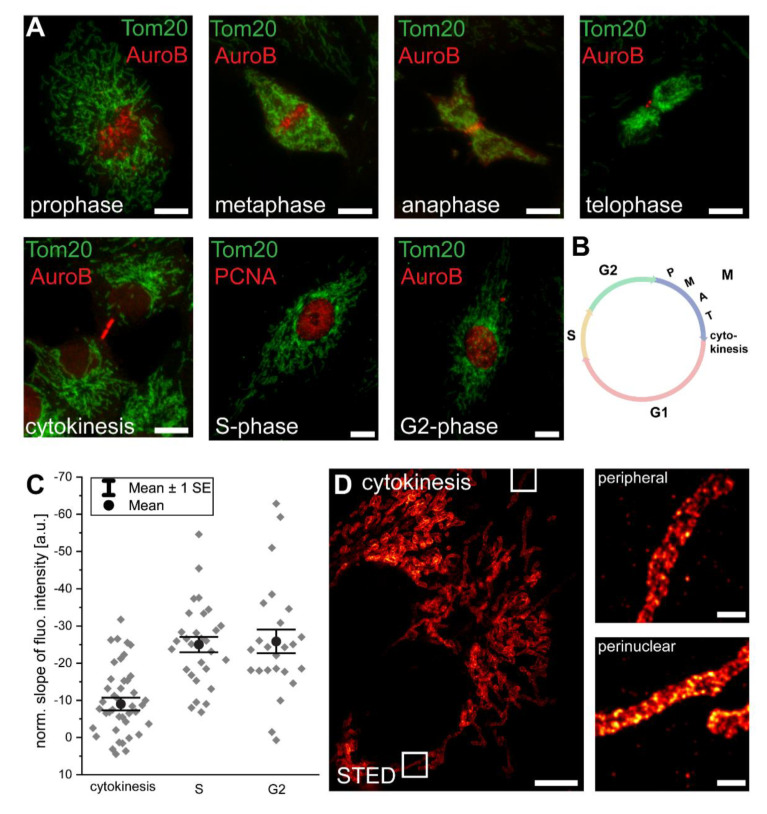
Figure 2.
Immediately after mitosis, a Tom20 abundance gradient is generated. (A) In a non-synchronized cell culture, cell-cycle stages were assigned using antisera against Aurora B kinase and PCNA. (B) Schematic of the cell cycle. (C) Analysis of the normalized slopes of the Tom20 fluorescence intensity gradients of cells at cytokinesis, S-phase, or G2-phase. Overlapping mitochondria were excluded from the analysis. Each grey rhomb represents one cell. Black circle: mean. Error bars: standard error of the mean. (D) STED microscopy of a cell at cytokinesis, labeled with antiserum against Tom20. Small images are magnifications of perinuclear or peripheral mitochondria as indicated by rectangles in the overview image. Scale bars: 0.5 µm (D: magnifications), 5 µm (D: overview), 10 µm (A).

