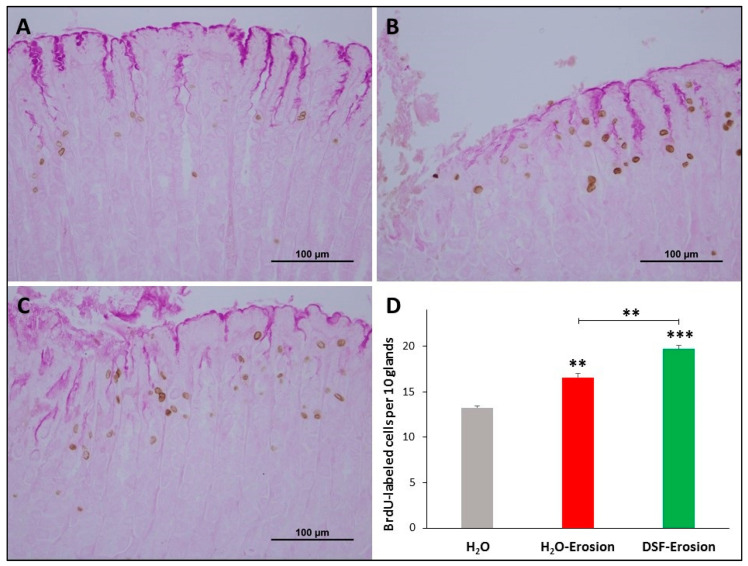
Figure 4.
BrdU labeling in the gastric mucosae of H2O control (A), erosion-induced (B) and DSF-pretreated then erosion-induced (C) mice. The tissues were counter-stained with PAS to show mucus-secreting pit cells at the luminal surface. (D) Counts of the BrdU-labeled cells in control, erosion-induced and DSF-pretreated then erosion-induced mice (n = 3 per group) are presented as mean ± SE. In this figure and all following figures, asterisks above columns indicate significant difference when the value of that column is compared with the H2O control. Asterisks above the line indicate differences between adjacent groups ** p < 0.01, *** p < 0.001; scale bar = 100 µm.

