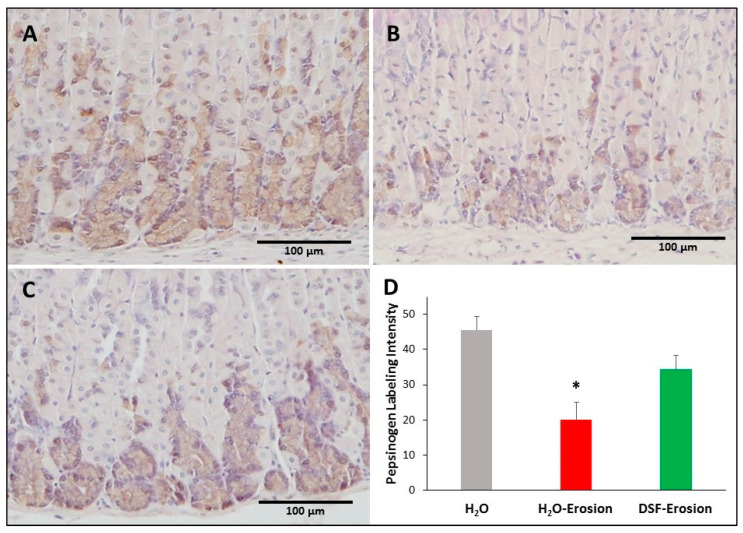
Figure 9.
Pepsinogen immunolabeling in the gastric mucosae of H2O control (A), erosion-induced (B) and DSF-erosion (C) mice. The tissue sections were counterstained with hematoxylin. Brownish pepsinogen-labeled cells are seen in the basal regions of the gastric mucosae. Labeled cells are more prominent in control and DSF-pretreated tissues than in erosion-induced tissues. (D) Quantification of pepsinogen labeling intensity (or percentage of labeled pixels in equivalent areas) of the mucosa of three mice in each group is presented as mean ± SE. * p < 0.05; scale bar = 100 µm.

