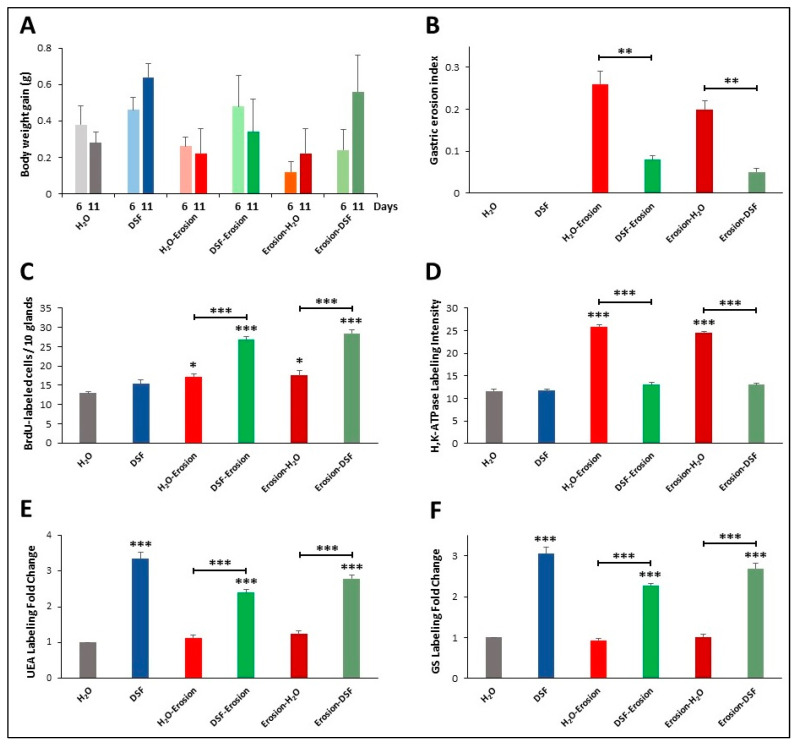
Figure 11.
Characterization of the 6 groups of mice of the second protocol of multiple-ASA-gavage erosion model. The graphs show body weight gain (A), gastric erosion index (B), BrdU-labeling (C), H+,K+-ATPase immunolabeling intensity (D), UEA lectin labeling (E) and GS lectin labeling (F). In all graphs, data are presented for each group of 5 mice as mean ± SE. Asterisks above the columns compare the value of that column with the H2O control group and on the horizontal lines compare adjacent paired groups. * p < 0.05, ** p < 0.01, *** p < 0.001.

