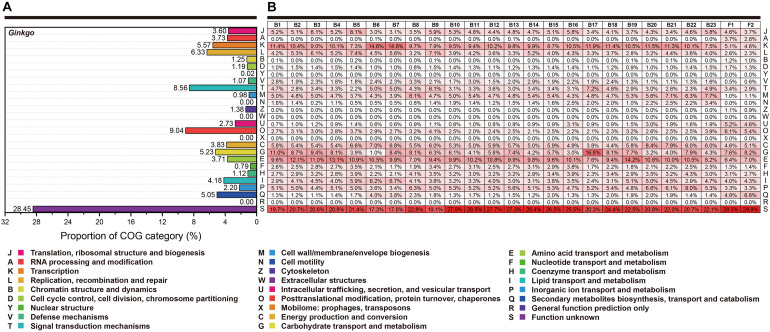
FIGURE 3.
The functional categories based on the COG annotation. Each row represents the same functional classification. (A) The COG categories of Ginkgo biloba genes. (B) The COG categories of genes for all individual strains. The red color density indicated the percentage of genes in this functional category to the total genes annotated in each species’ COG database. At the same time, these percentage values (keep one decimal place) were marked in every square grid.

