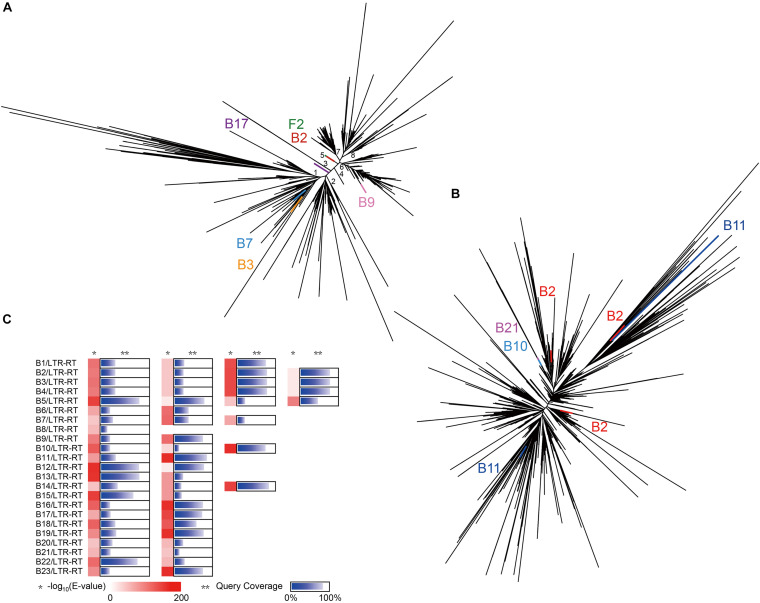
FIGURE 5.
Evolution of LTR-RTs in all isolates and Ginkgo. (A) The phylogenetic tree of the Ty3/Gypsy superfamily predicted in all isolates and Ginkgo. The lines of the same color indicated the same endogenous strain, and the black lines indicated the sequences of the Ginkgo host. (B) The phylogenetic tree of the Ty1/Copia superfamily predicted in all isolates and Ginkgo. (C) The BLASTN output of CDSs predicted in all LTRs in isolates against the Ginkgo CDSs. The shade of red rectangles means the magnitude of the E-value, and the length of the blue bar indicates the coverage of the query sequence of CDSs predicted in all LTRs in isolates. Multiple cases in each row represent multiple LTR-RTs of the same endophyte.

