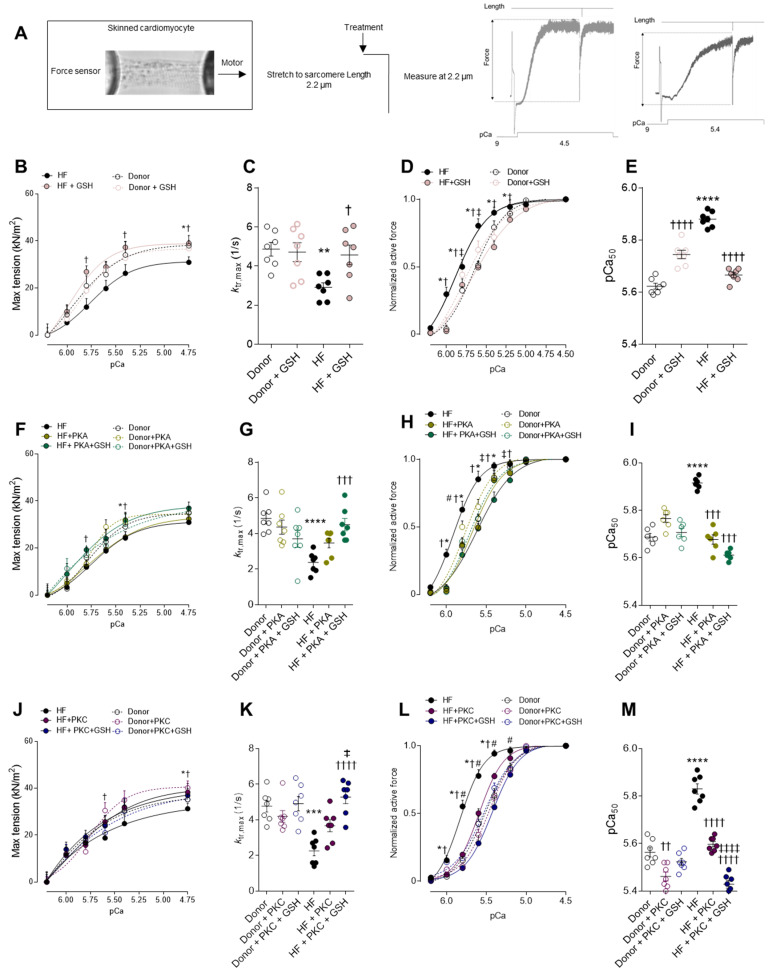
Figure 1.
Cardiomyocyte max tension and calcium sensitivity. (A) Representative image of skinned cardiomyocytes and stretch protocol. (B) Maximum tension of donors and HF cardiomyocytes before and after reduced glutathione (GSH) treatment at different calcium concentrations. (C) Bars indicate ktr at saturating [Ca2+] (at pCa 4.5; ktr, max) before and after GSH treatment. (D) Calcium sensitivity of donors and HF cardiomyocytes with and without GSH treatment at different calcium concentrations. (E) pCa value for the half-maximal Ca2+-induced contraction before and after GSH. (F) Maximum tension of donors and HF cardiomyocytes with and without protein kinase A (PKA) treatment, and after incubations with both PKA and GSH at different calcium concentrations. (G) Bars indicate ktr at saturating [Ca2+] (at pCa 4.5; ktr, max) before and after PKA treatment. (H) Calcium sensitivity of donors and HF cardiomyocytes before and after PKA treatment at different calcium concentrations. (I) pCa value for the half-maximal Ca2+-induced contraction before and after GSH. (J) Maximum tension of donors and HF cardiomyocytes with and without protein kinase C (PKC) treatment and after incubations with both PKC and GSH at different calcium concentrations. (K) Bars indicate ktr at saturating [Ca2+] (at pCa 4.5; ktr, max) before and after PKC treatment. (L) Calcium sensitivity of donors and HF cardiomyocytes before and after PKC treatment at different calcium concentrations. (M) pCa value for the half-maximal Ca2+-induced contraction before and after GSH. Data are shown as mean ± SEM, (n = 16–20/4 cardiomyocytes/heart). * p < 0.05/** p < 0.01/*** p < 0.001/**** p < 0.0001 donor vs. HF, † p < 0.05/†† p < 0.01/††† p < 0.001/†††† p < 0.0001 HF before vs. after GSH or PKA, ‡ p < 0.05 HF before vs. after GSH + PKA or +PKC, and # p < 0.05 donor before vs. after PKA by one-way ANOVA. P-values were corrected for multiple comparisons by the Tukey method.

