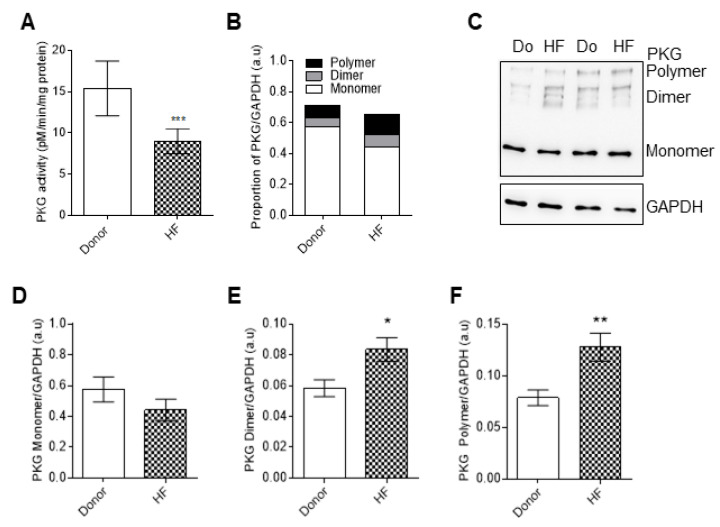
Figure 6.
Protein kinase G (PKG) activity and analysis of monomer, dimer, and polymer formation in HF cardiomyocytes. (A) Protein kinase G (PKG) activity. (B) Proportion of PKG monomers, dimers, and polymers. (C) Representative blot of PKG monomers, dimers, and polymers. (D) PKG monomer levels. (E) PKG dimer levels. (F) PKG polymer levels. Data are shown as mean ± SEM. * p < 0.05/** p < 0.01/*** p < 0.001 donor vs. HF by Student t-test (n = 8–10, hearts per group).

