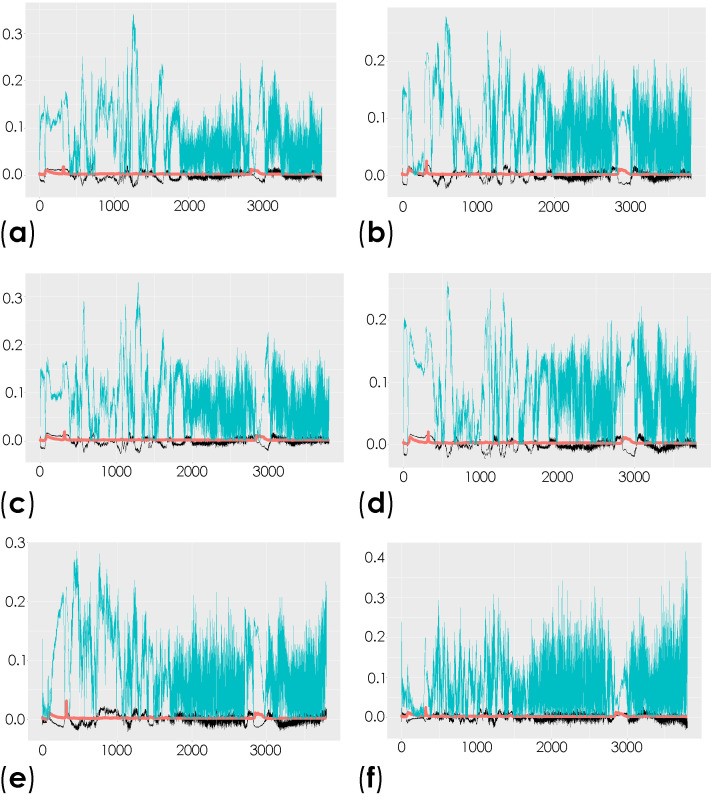
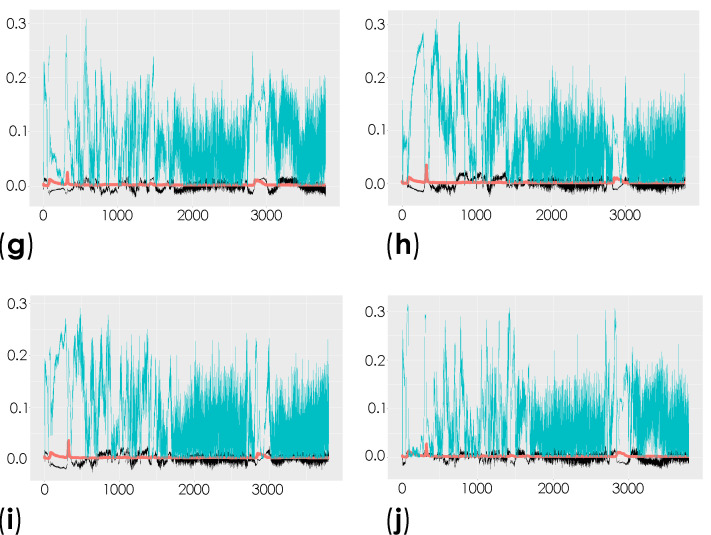
Figure 4.
Representation of the coefficient loading plots of the Raman spectra of the unlabeled dECM samples. Different groups were compared: control versus saline contralateral hemisphere (SAL CT) (a); control versus saline ipsilateral hemisphere (SAL IP) (b); control versus 6-OHDA-lesioned contralateral hemisphere (PD CT) (c); control versus 6-OHDA-lesioned ipsilateral hemisphere (PD IP) (d); saline contralateral hemisphere (SAL CT) versus saline ipsilateral hemisphere (SAL IP) (e); saline contralateral hemisphere (SAL CT) versus 6-OHDA-lesioned contralateral hemisphere (PD CT) (f); saline contralateral hemisphere (SAL CT) versus 6-OHDA-lesioned ipsilateral hemisphere (PD IP) (g); saline ipsilateral hemisphere (SAL IP) versus 6-OHDA-lesioned contralateral hemisphere (PD CT) (h); saline ipsilateral hemisphere (SAL IP) versus 6-OHDA-lesioned ipsilateral hemisphere (PD IP) (i); 6-OHDA-lesioned contralateral hemisphere (PD CT) versus 6-OHDA-lesioned ipsilateral hemisphere (PD IP) (j).


