Figure 5.
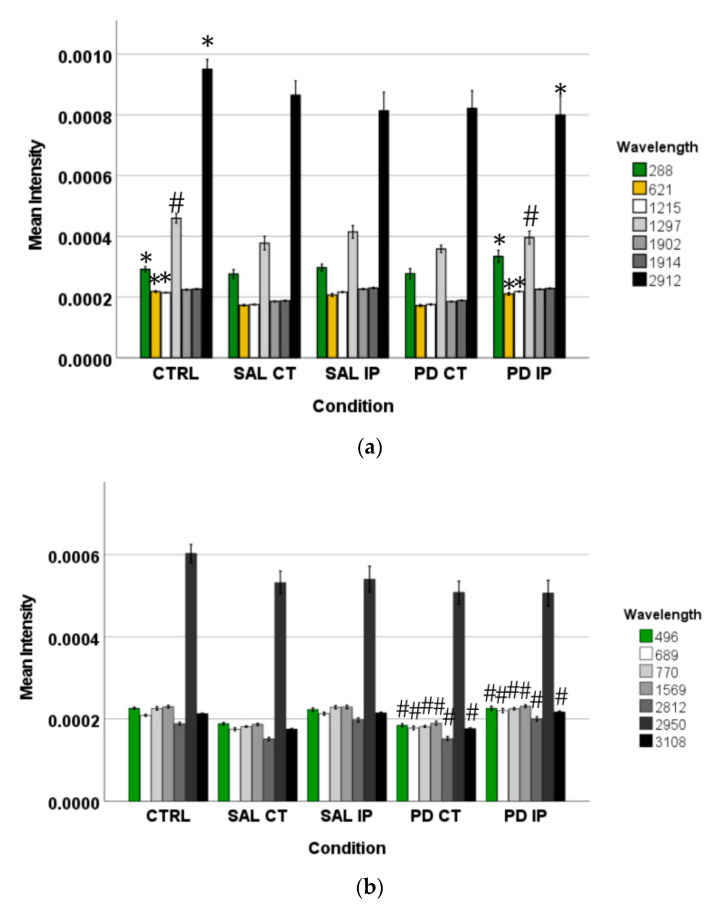
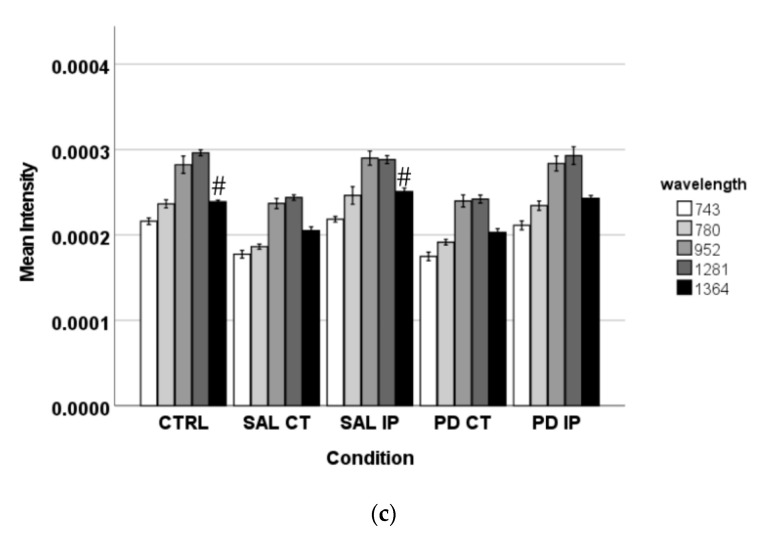
The intensity of the peaks responsible for the separation of the different groups of unlabeled samples found by OPLS-DA was measured in the corresponding Raman spectra. The graphs represent their mean intensity ± SEM from the spectra acquired in the interval from 0 to 3800 cm−1. (a) Values for the unique peaks appearing in the comparison between control (CTRL) and the ipsilateral hemisphere of the 6-OHDA-lesioned mice (PD IP). (b) Values for the unique peaks appearing in the comparison between both hemispheres of the 6-OHDA-lesioned mice (PD CT and PD IP). (c) Values for the unique peaks appearing in the comparison between control (CTRL) and the ipsilateral hemisphere of the saline mice (SAL IP). One-way ANOVA or Welch’s ANOVA followed by Bonferroni or Games-Howell post hoc test, respectively, was performed, with * p < 0.05 and # p < 0.001. The sampling distribution was first tested for normality using the Shapiro-Wilk test and for homogeneity of variances using the Levene’s test.


