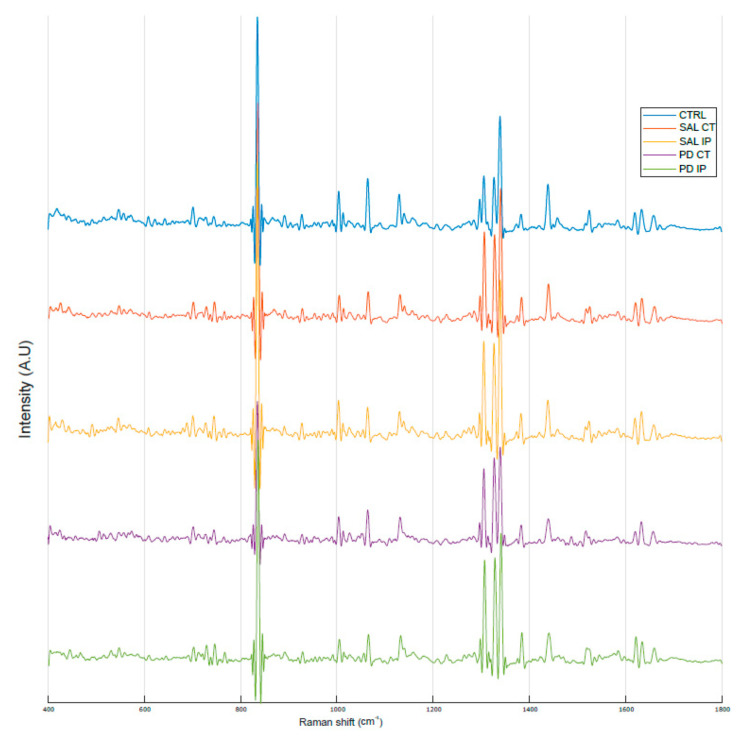
Figure 6.
Raman oxidative fingerprint from the average spectra of striatal dECM samples. The spectral interval used for acquisition was from 400 to 1800 cm−1. For representation purposes, Matlab software was used to obtain the average smoothed spectra with background subtraction for the striatal decellularized matrices from the control mice (CTRL; total of 57 spectra in blue), saline contralateral hemisphere (SAL CT; total of 48 spectra in orange), saline ipsilateral hemisphere (SAL IP; total of 47 spectra in orange), 6-OHDA-lesioned contralateral hemisphere (PD CT; total of 26 spectra in yellow), and 6-OHDA-lesioned ipsilateral hemisphere (PD IP; total of 42 spectra in green).

