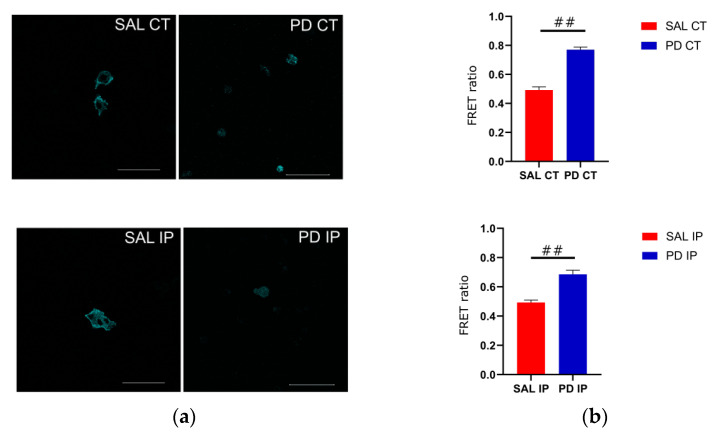
Figure 8.
Cells that grew on the striatal decellularized matrices (Scheme 2). (a) OS cells expressing the actinin-sstFRET mechanosensor and growing on the decellularized matrices of the contralateral and ipsilateral hemispheres from the saline and 6-OHDA-lesioned mice. The cerulean (donor) image is shown; scale bar 100 μm. (b) Comparison of the calculated FRET ratio for all of the conditions, cells growing in the contralateral and ipsilateral hemispheres from the saline (SAL CT and SAL IP) and 6-OHDA-lesioned (PD CT and PD IP) mice. Values are shown indicating the mean value + SEM. One-way ANOVA followed by Bonferroni post hoc test was performed (## p < 0.001). The sampling distribution was first tested for normality using the Shapiro−Wilk test and for the homogeneity of variances using the Levene’s test.

