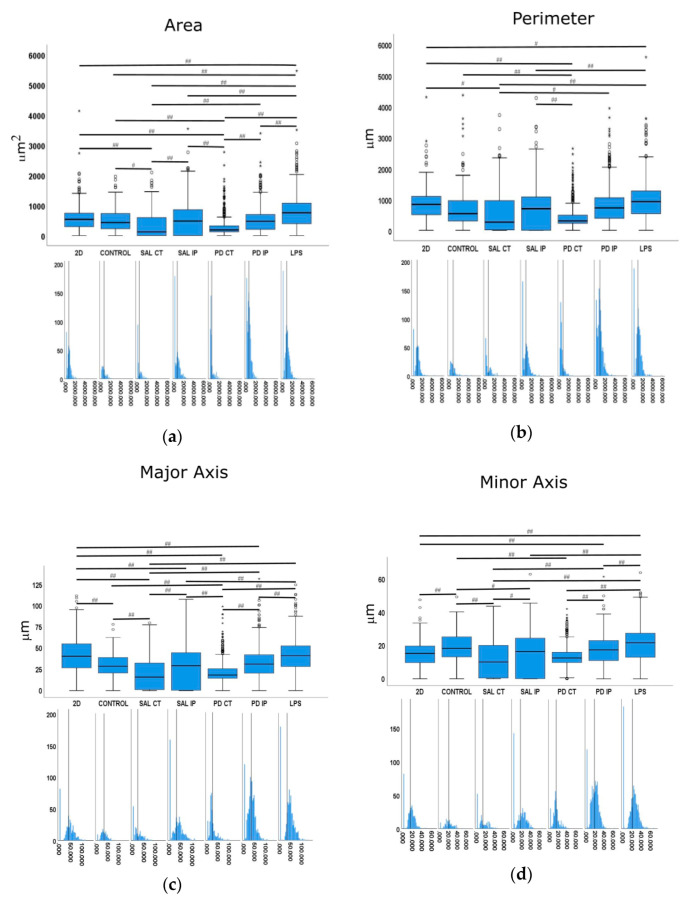
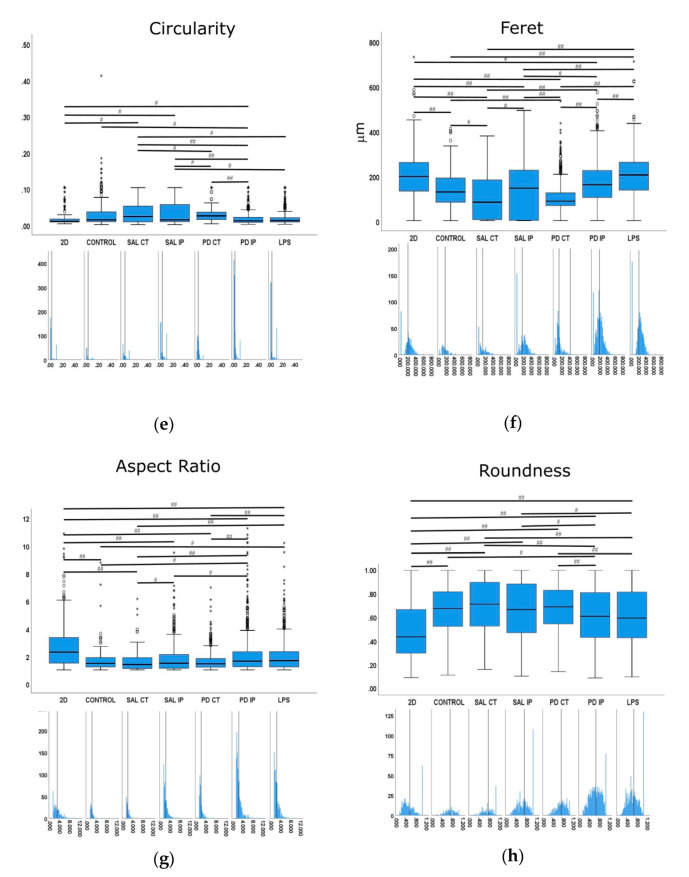
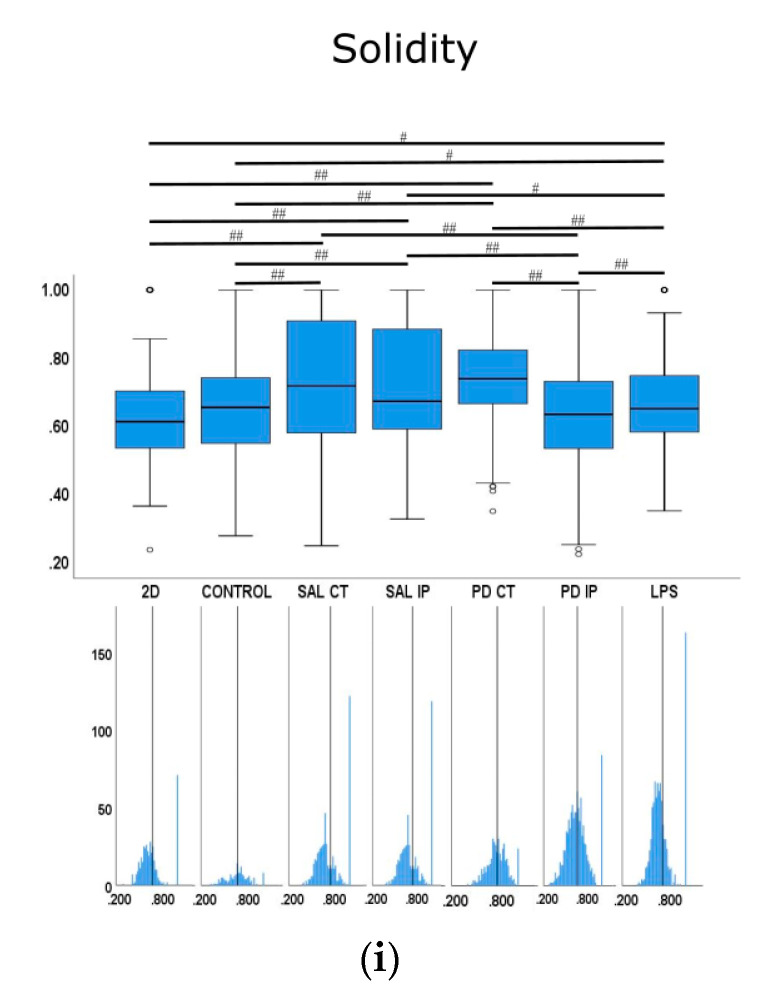
Figure 10.
Quantitative morphometric analysis of microglia growing in repopulated striatal decellularized matrices. Nine shape descriptors are quantified for microglia growing in the decellularized matrices from the control animals (CONTROL), matrices from the contralateral and ipsilateral hemispheres of saline and 6-OHDA-lesioned mice (SAL CT, SAL IP, PD CT, and PD IP, respectively), and 2D surface (with and without LPS stimulation). Area (a), perimeter (b), major axis (c), minor axis (d), circularity (e), Feret’s diameter (f), aspect ratio (g), roundness (h), and solidity (i). The values for the corresponding feature are shown as a box displaying the maximum, minimum, and mean ± SEM values. Welch’s ANOVA followed by Games Howell post hoc test were performed (# p < 0.05 and ## p < 0.001). Outliers are marked with the symbols ° and *. The sampling distribution was tested for normality using the Shapiro−Wilk test and for homogeneity of variances using the Levene’s test. Frequency distribution plots for individual cells are shown below each boxplot, with the vertical line indicating the respective population mean.


