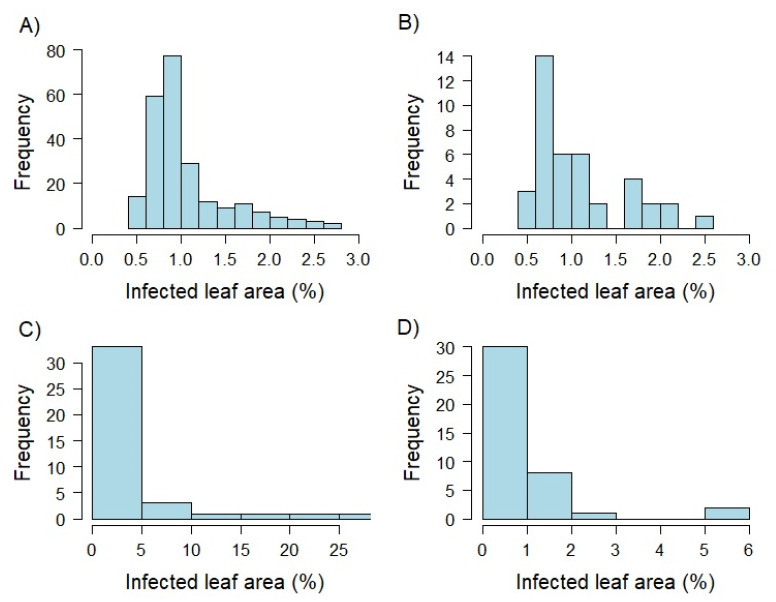
Figure 1.
Histograms showing the distribution of best linear unbiased estimates (BLUEs) based on detached leaf assays produced within greenhouse experiments. Percentage of infected leaf area was determined by an automated phenotyping platform using image analysis. The whole genotype set was examined as two leaf seedlings (EC 12; A). In addition, a limited set of 40 genotypes was tested 10 days (EC 12; B), 5 weeks (EC 19; C), and 10 weeks (EC 25; D) after sowing.

