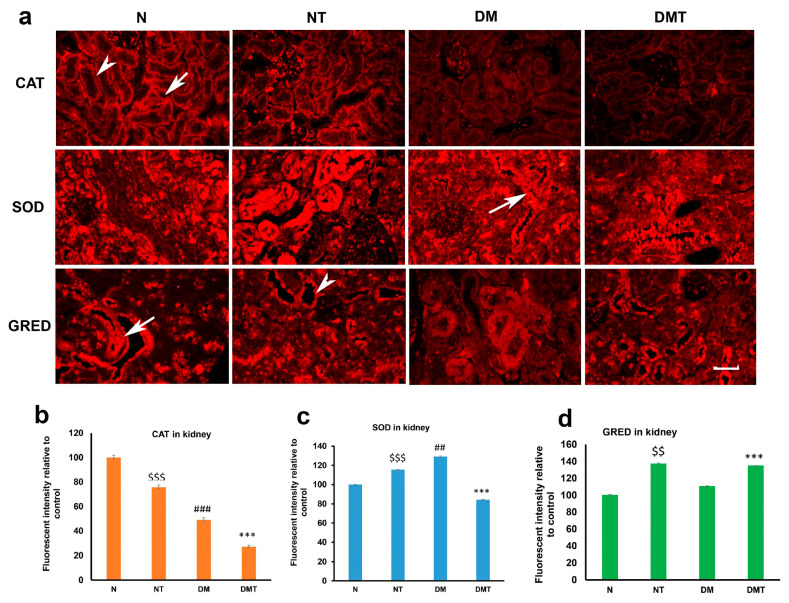
Figure 1.
Images (a) of immunohistochemistry showing catalase (CAT), superoxide dismutase (SOD), and glutathione reductase (GRED) expression in the cortex of the kidney of normal (N), normal treated (NT), diabetic untreated (DM) and diabetic treated with nociceptin (DMT). While nociceptin has variable effects on CAT and SOD expression, the tissue expression of GRED increased significantly after nociceptin treatment in both normal and diabetic rats (b–d). Proximal convoluted tubules (arrow); distal convoluted tubules (arrow head); n = 6; Scale bar = 25 µm; Magnification = ×400; $$ and $$$ (normal treated versus normal untreated); ## and ### (diabetic untreated versus normal untreated); *** (diabetic untreated versus diabetic treated) $$ p < 0.05, $$$ p < 0.001; *** p < 0.001; ### p< 0.001.

