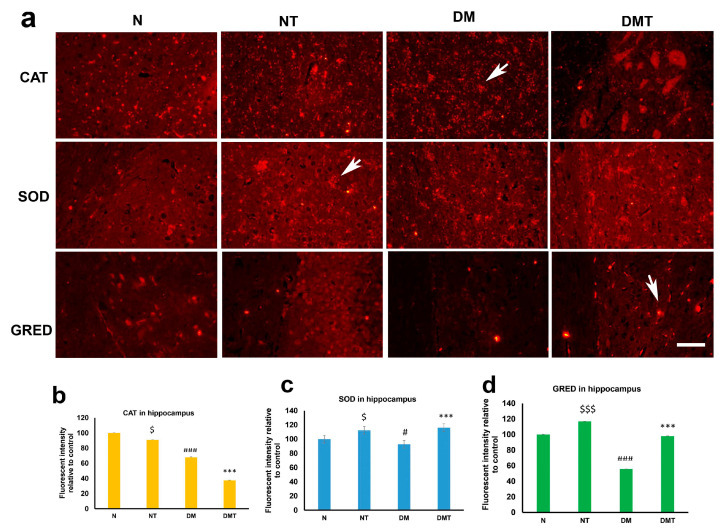
Figure 5.
Immunofluorescence images (a) of catalase (CAT), superoxide dismutase (SOD), and glutathione reductase (GRED) expression in the CA3 region of the hippocampus of normal (N), normal treated (NT), diabetic untreated (DM) and diabetic treated with nociceptin (DMT). Note that the expressions of CAT is reduced after nociceptin treatment. However, nociceptin caused large and significant increases in SOD and GRED expression in the neurons (arrows) of hippocampus and normal and diabetic rats compared to controls (b–d). n = 6, Scale bar = 25 µm; Magnification = ×400; $ and $$$ (normal treated versus normal untreated); # and ### (diabetic untreated versus normal untreated); *** (diabetic untreated versus diabetic treated) $ p < 0.05; $$$ p < 0.01; ### p < 0.001; *** p < 0.001.

