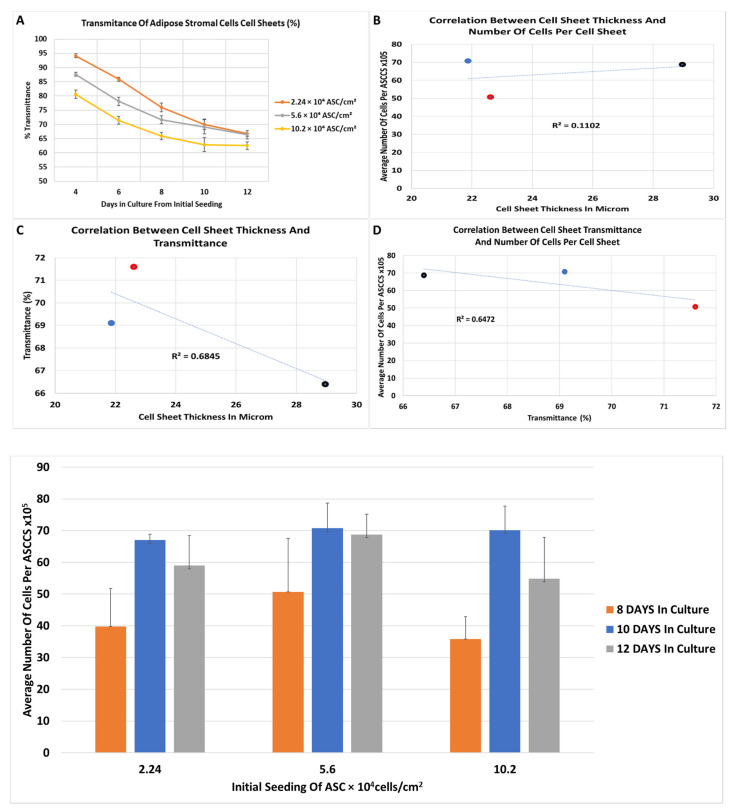
Figure 6.
(A) Transmittance of the cell sheets at different initial cell density, over 12 days. 75% (Day 4: n = 20; Day 6: n = 20; Day 8: n = 20 except for the 10.2 × 10⁴/cm2 group where n = 16; Day 10: n = 16 for 2.24 × 10⁴/cm2 and n = 12 for 5.6 × 10⁴/cm2 and 10.2 × 10⁴/cm2; Day 12: n = 12 for 2.24 × 10⁴/cm2 and n = 8 for 5.6 × 10⁴/cm2 and 10.2 × 10⁴/cm2). p-value of <0.01 when compare same initial seeding between the days or when compared the 3 groups in the same day. No difference was measured at 12 days, between 2 and 5 × 10⁵ cells initial seeding. (B) It shows the non-correlation between the cell sheet thickness and the number of cells per cell sheets. (C) It shows the non-correlation between the cell sheet thickness and the loss of transmittance. (D) It shows the non-correlation between the loss of transmittance and the number of cells per cell sheet. (For (B–D): Cell sheets engineered with initial seeding with 5.6 × 10⁴/cm2, for 8, 10, and 12 days were studied to establish a correlation between the transmittance, thickness and the number of cells per cell sheets. Cell sheets used to determine the number of cells per cell sheet n = 6; cell sheets used to determine the cell sheet thickness n = 4; cell sheets to determine the transmittance are 20 for day 8, 12 for day 10, and 8 for day 12; dots in red represent the cell sheets harvest at day 8, dots in blue the cell sheets harvested on the 10th day, black dots are the cell sheets harvested on the 12th day). (E) It shows the content of DNA in whole ASCCS, using as a reference the dsDNA purified from isolated adipose stromal cells. For all groups, there is a significant difference between 8 days vs 10 days and 8 days vs 12 days (p < 0.05), and no significant difference between the 10 and 12 days in culture (n = 6, mean ± SD).

