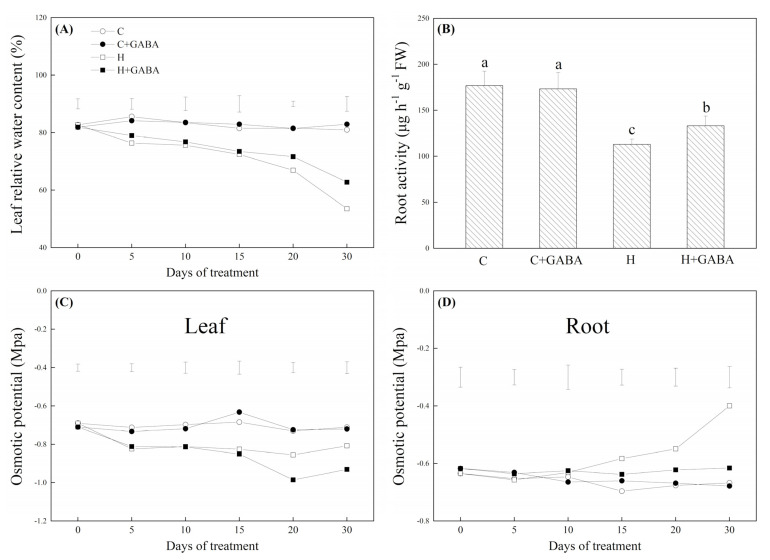
Figure 9.
Effects of GABA application on leaf relative water content (A), root activity (30th day) (B), and osmotic potential of leaves (C) or of roots (D) of plants under normal-temperature and high-temperature stress. Vertical bars above curves in (A), (C), or (D) represent the least significant difference (LSD) values at a particular day (n = 4; p ≤ 0.05). The vertical bar above the column in (B) represents + SE of the mean (n = 4) and the different letters in the columns indicate significant differences based on LSD (p ≤ 0.05). C, control (normal condition); C + GABA, control plants pretreated with GABA; H, heat stress (normal condition); H + GABA, heat-stressed plants pretreated with GABA.

