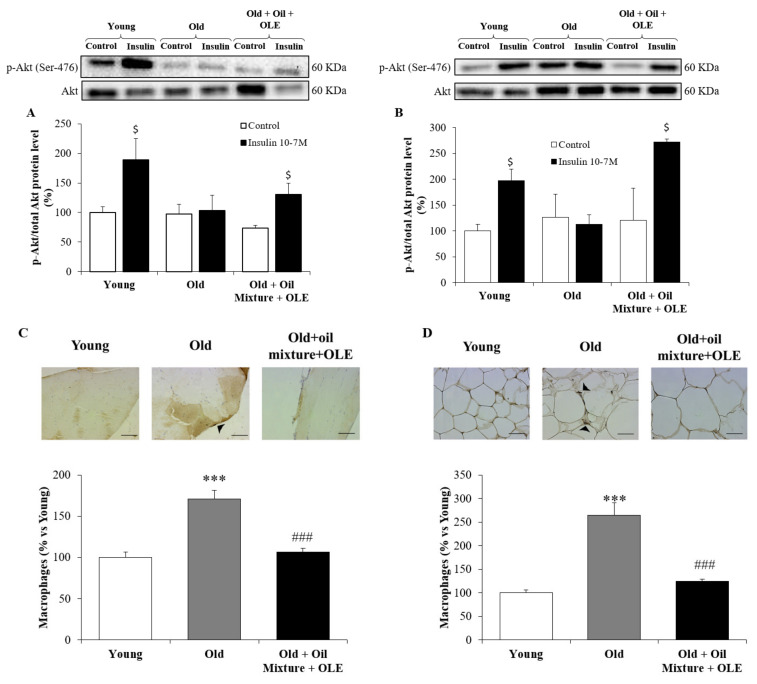
Figure 3.
Ratio between protein levels of p-Akt and Akt in gastrocnemius (A) and epididymal visceral adipose tissue (B); and macrophages infiltration by immunohistochemistry in gastrocnemius (C) and epididymal visceral adipose tissue (D) of young rats, old rats and old rats treated 21 days with the Oil Mixture and the OLE. Values are represented as mean ± SEM. *** p < 0.001 vs. Young; ### p < 0.001 vs. Old; $ p < 0.05 vs. Control. Black line in the immunohistochemistry pictures represents 50 µm.

