Figure 2.
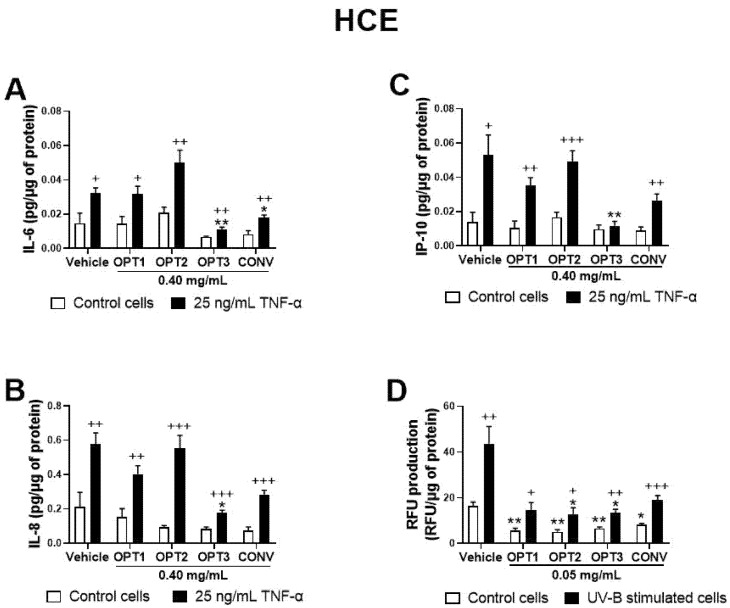
Screening of the anti-inflammatory and antioxidant activity of the conventional (CONV) and the three optimized (OPT1, OPT2, and OPT3) Olive Pomace (OP) extracts on TNF-α-induced cytokine release and UV-B-induced reactive oxygen species (ROS) production by HCE cells, respectively. For cell cytokine stimulation, cells were pre-treated with vehicle (0.4% ethanol) or 0.40 mg/mL of CONV, OPT1, OPT2, and OPT3 for 2 h. Following this, they were stimulated with 25 ng/mL TNF-α in the presence of the treatments for 24 h (A–C, black bars). Vehicle-treated-TNF-α stimulated cells and cells not stimulated with TNF-α (A–C, white bars) were used as control. IL-6, IL-8, and IP-10 were measured in cell supernatants by a multiplex bead-based array. OPT3 inhibited all measured cytokines/chemokines (A–C), while CONV significantly decreased IL-6 (A). For the UV-B-induced ROS production, cells were pre-treated with vehicle (0.4% ethanol) or 0.05 mg/mL of CONV, OPT1, OPT2 and OPT3 for 1 h. Subsequently, cells were incubated with 10 μM H2DCF-DA solution for 30 min, and then treated with the treatments and exposed to 107.25 mJ/cm2 UV-B light (D, black bars). After 1 h of incubation, intracellular fluorescence intensity was measured. Vehicle-treated-UV-B stimulated cells and cells not stimulated with UV-B (D, white bars) were used as control. OPT2 and OPT3 decreased ROS levels significantly. Data are presented as picograms (pg) of cytokine/chemokine (for cell cytokine stimulation) or relative fluorescence units (RFUs) (for ROS production) normalized to micrograms (μg) of total protein for three independent experiments (performed in duplicate) ± SEM. * p < 0.05, ** p < 0.01, compared with vehicle-treated cells; + p < 0.05, ++ p < 0.01, +++ p < 0.001, compared with control cells. Vehicle: 0.4% EtOH.

