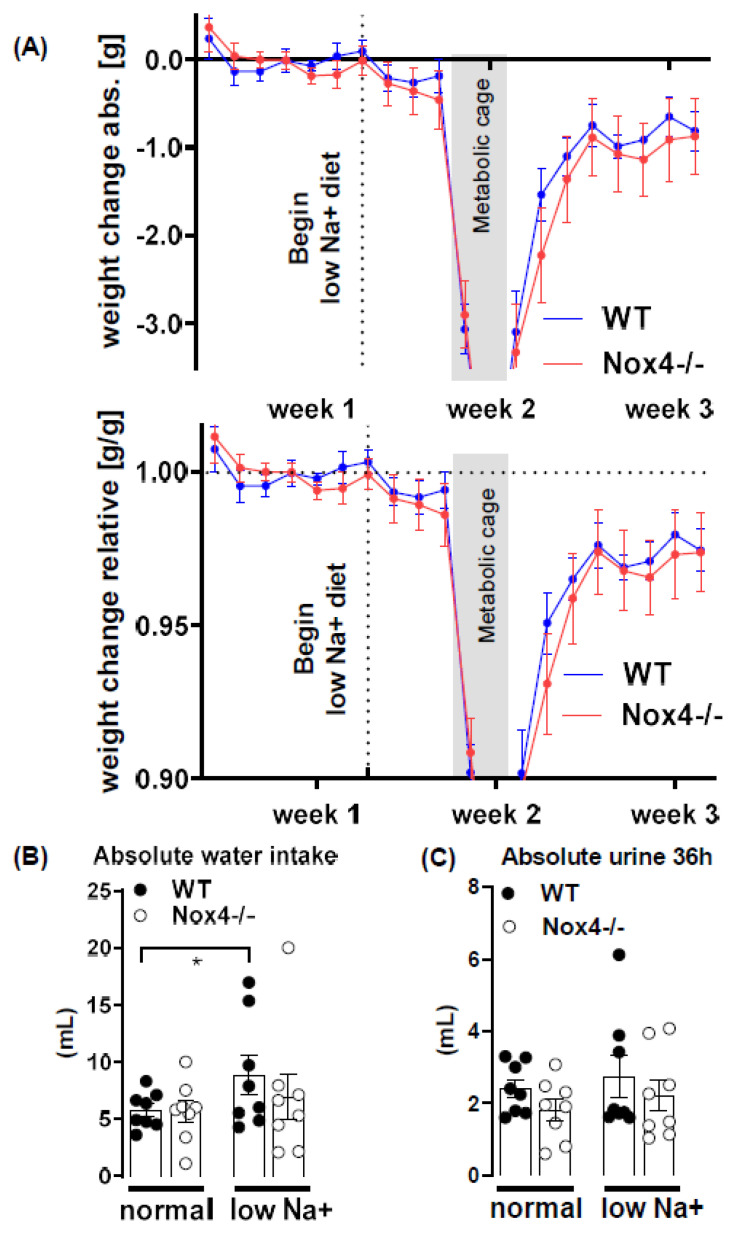
Figure 3.
Effect of diet on weight, water intake und urine excretion. (A): absolute and relative weight change during the experiment. The grey box indicates the time mice were kept in metabolic cages. Vertical dotted line indicates the beginning of a low sodium diet. (B,C): Absolute water intake and urine production determined in the metabolic cage before and 3 days after the initiation of a low sodium diet. (36 h collection time) n = 8. * p < 0.05 paired Wilcoxon test, data are mean ± SEM.

