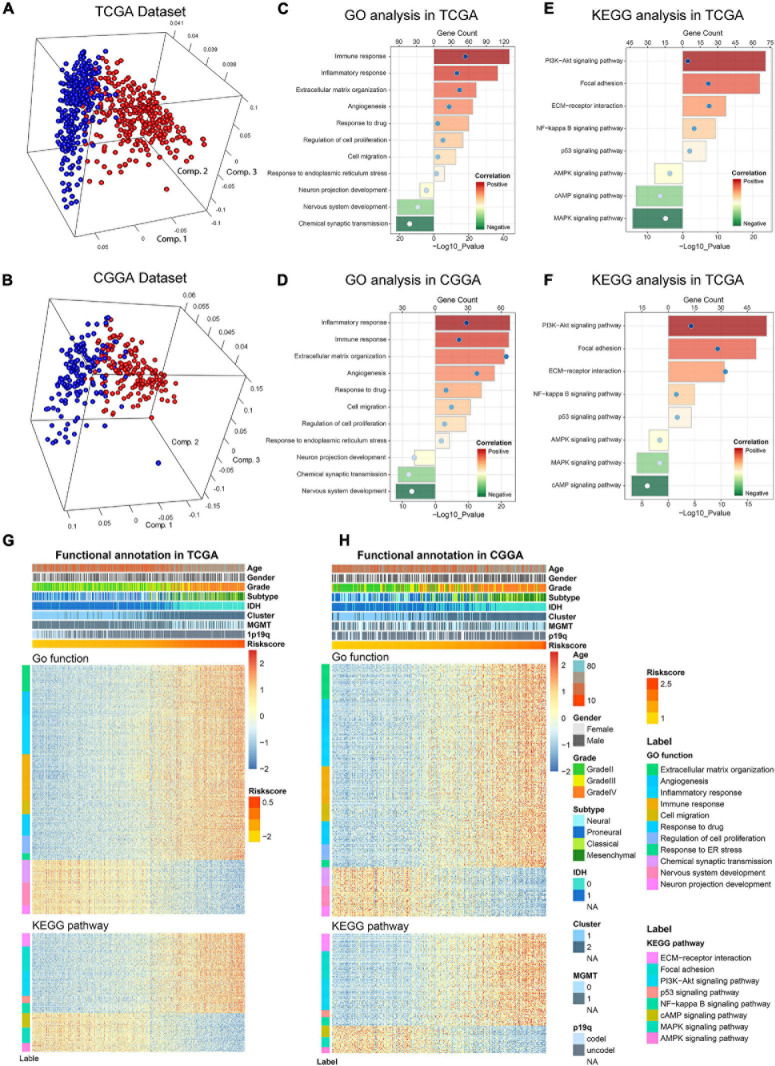
FIGURE 5.
Biological functions and pathways analyses of the ER stress-related signature in TCGA and CGGA datasets. (A,B) There is a significant separation between high-risk and low-risk groups in PCA analysis based on whole gene expression data. (C,D) GO analyses were performed to explore the biological processes tightly related to the risk signature. (E,F) KEGG pathway analyses were performed to explore the signaling pathways tightly related to the risk signature. (G,H) The heatmaps showed the association among risk score, clinicopathological features and ER stress-related biological functions and pathways.

