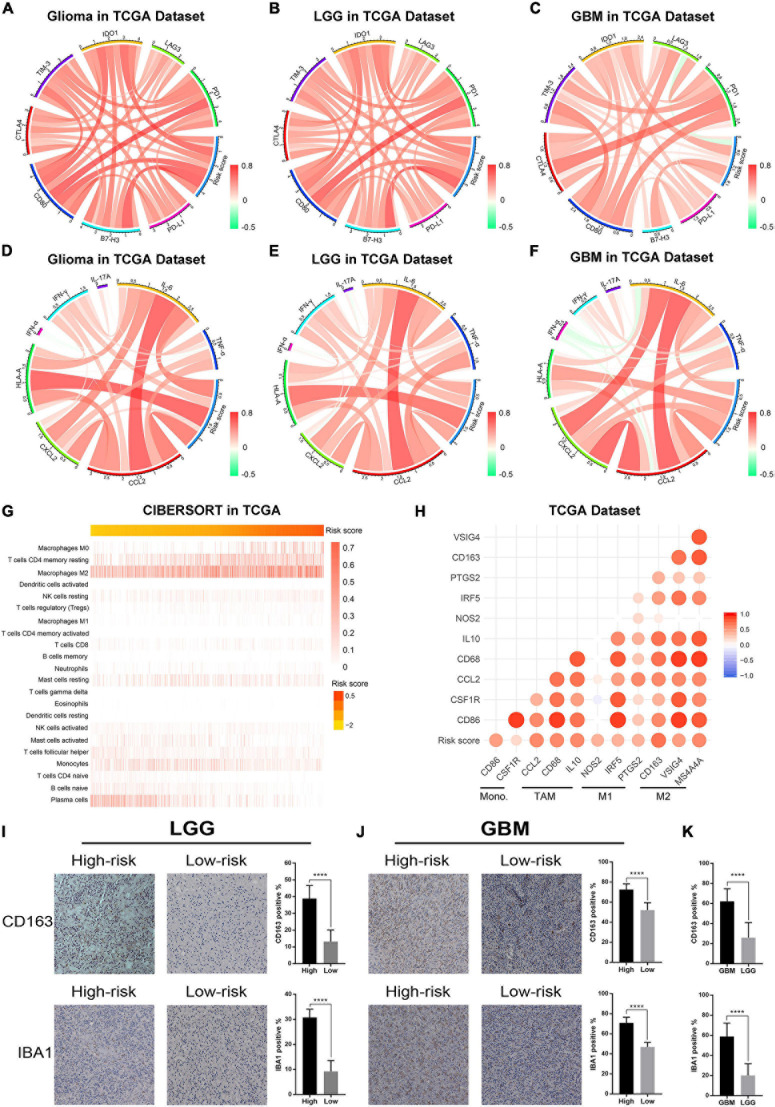
FIGURE 6.
The ER stress activation related immunologic events in glioma samples in TCGA dataset. (A–C) Correlation analysis between risk score and immune checkpoints in whole gliomas, low-grade gliomas and GBM, respectively. (D–F) Correlation analysis between risk score and inflammatory genes in whole gliomas, low-grade gliomas and GBM, respectively. (G) CIBERSORT was performed to evaluate the proportion of various types of immune cell infiltrated into glioma samples. (H) Correlation analysis between risk score and biomarkers of monocytes and macrophages. (I) IHC staining and positive rate statistics of CD163 and IBA1 in LGG samples from the CGGA dataset. (J) IHC staining and positive rate statistics of CD163 and IBA1 in GBM samples from the CGGA dataset. (K) Positive rate statistics of CD163 and IBA1 between LGG and GBM samples from the CGGA dataset. ****p < 0.0001.

