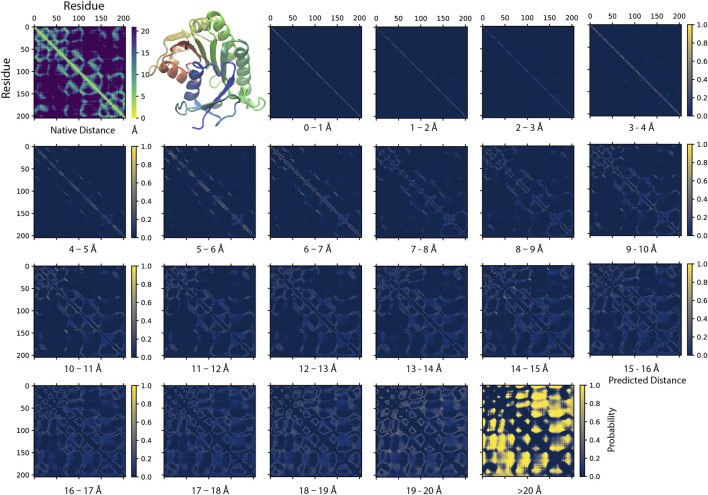
FIGURE 2.
An example of predicting residue-residue distance matrices by SAdLSA self-alignment. The native (experimental) structure (PBD ID: 1hdo, chain A; SCOP ID: d1hdoa_) of the target sequence, human Biliverdin IXβ reductase, encodes a classic Rossman fold shown in the cartoon representation using the red-green-blue color scheme from the N to C-terminus. For each pair of residues, its experimentally observed (native) Cα-Cα distance is shown in the upper left corner. The remaining 21 probability density plots are generated by SAdLSA self-alignment for the target sequence. Each plot predicts the probability of Cα-Cα distance within a distance bin from 0 to 20 Å at 1 Å spacing, and the probability >20 Å in the last plot.

