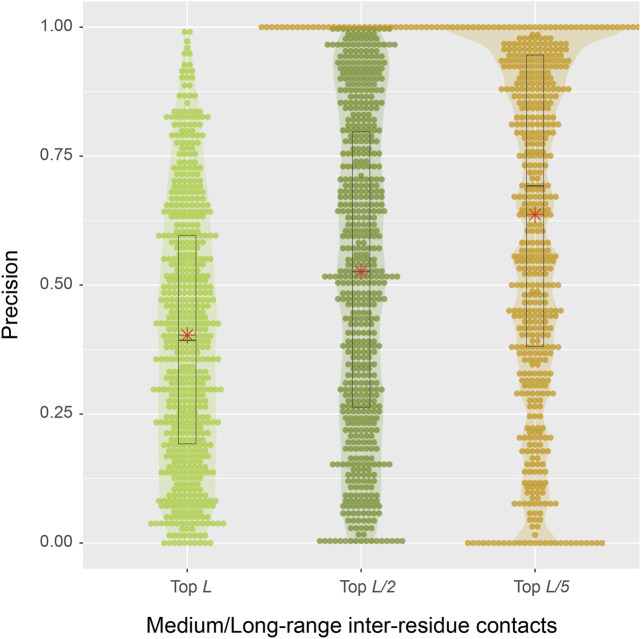
FIGURE 4.
Precision of inter-residue contact predictions via SAdLSA self-alignment. The precision of the top L (light green), L/2 (green), and L/5 (gold) are shown as circles for each target sequence. Violin contours are proportional to the counts of targets at different precision levels with a bin width of 0.01. Black boxes, median bars and means are represented following the same plotting scheme as in Figure 3.

