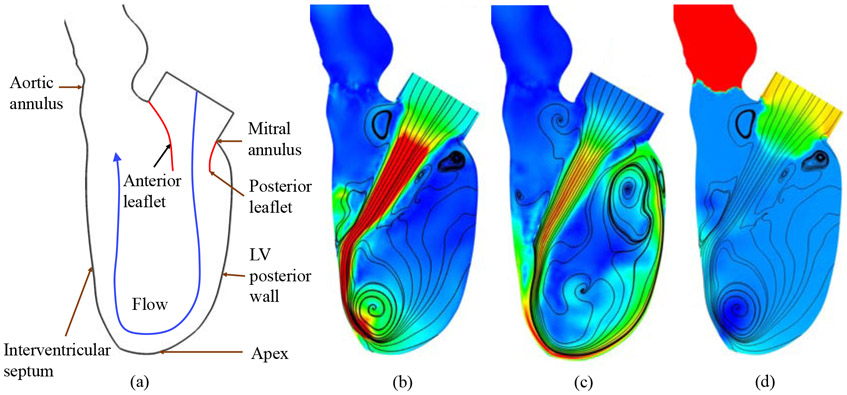
Figure 6:
Comparison of flow circulatory patterns in the LV during diastole: (a) schematic of the flow direction resulting from a typical native valve [8]; (b) streamlines and velocity magnitude contours for the BHV FSI results at t = 0.472 s; (c) streamlines and velocity magnitude contours for the BHV FSI results at t = 0.552 s; (d) pressure contours at t = 0.472 s. Velocity magnitude contours are plotted using a color scale ranging from 0 (blue) to ≥ 200 cm/s (red) in (b) and (c). Pressure contours are plotted using a color scale ranging from ≤ −5 (blue) to ≥ 5 mmHg (red) in (d).

