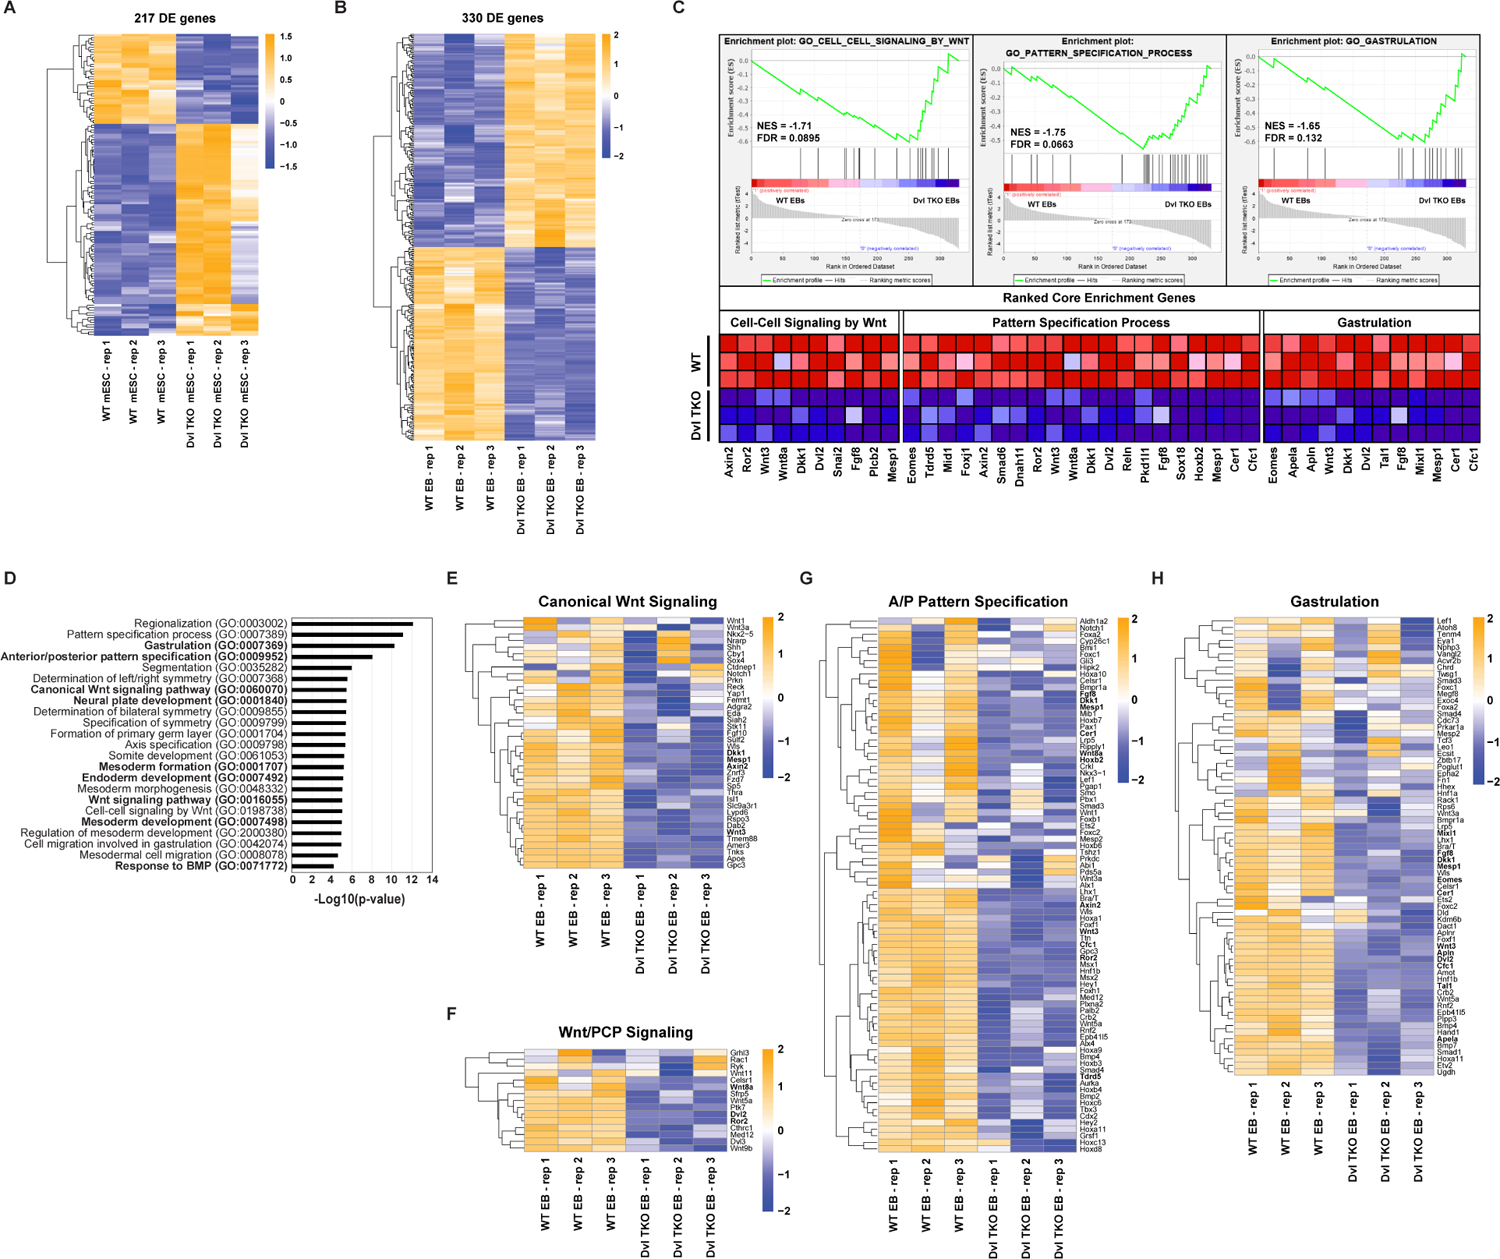
Figure 3: Identification of Gene Dysregulation in Developmental Processes and Pathways with Dvl Loss During Differentiation.

A) Heatmap of unsupervised hierarchical clustering of 217 significantly (FDR < 0.05) differentially expressed (DE) genes in biological triplicates of WT and Dvl TKO mESCs. B) Heatmap of unsupervised hierarchical clustering of 330 DE genes (FDR < 0.05) (173 up-regulated and 157 down-regulated in Dvl TKO EBs) in WT and Dvl TKO EBs during differentiation. C) Gene set enrichment analysis (GSEA) of 330 DE genes identified in WT and Dvl TKO EBs. Normalized Enrichment Score (NES) and FDR are shown for the top biological processes. The ranked core genes contributing to the NES are shown. D) Gene ontology (GO) analysis of the significantly 157 down-regulated genes in Dvl TKO EBs to identify the represented biological processes. E-H) Heatmaps of unsupervised hierarchical clustering of the relative gene expression of the specific GO terms highlighted in bold were further analyzed. The core GSEA genes are highlighted in bold in each of the following heatmaps. E-F) To infer canonical and non-canonical Wnt signaling functional activity, the gene expression levels of known regulatory and target genes were compared among WT and Dvl TKO EBs. G-H) In Dvl TKO EBs, significant down-regulation is observed in several genes involved in G) anterior-posterior pattern specification and H) gastrulation induction. All heatmap scales represent the Z-score of gene expression.
