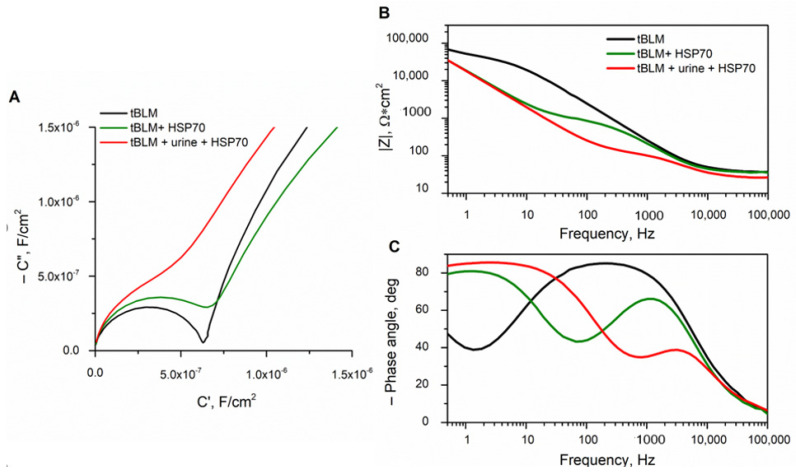
Figure 6.
Comparison of the impact of HSP70 on tBLM in urine (red) and buffer (green) media: (A) The Cole–Cole plot of complex capacitance. Spectra is enlarged high-frequency part of the spectrum. The curves refer to the same Bode spectra as in B and C; (B) impedance magnitude vs. frequency (Bode) plots; and (C) impedance phase vs. frequency (Bode) plots. tBLMs were completed with the DOPC:CHO (in ratio % 60:40) phospholipid mixture. HSP concentration was kept 0.05 µM. The sample size for this experiment was n = 12.

