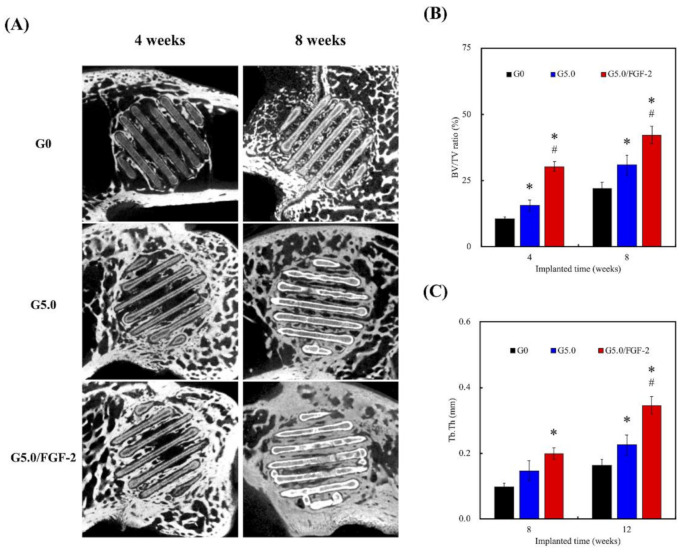
Figure 10.
(A) Micro-CT image of the bone defects; (B) the quantified bone volume/total volume (BV/TV); (C) micro-CT quantified trabecular thickness (Tb.Th) analysis at various time points. * indicates a significant difference (p < 0.05) when compared to G0. # indicates a significant difference (p < 0.05) when compared to G5.0. The scale bar is 2 mm.

