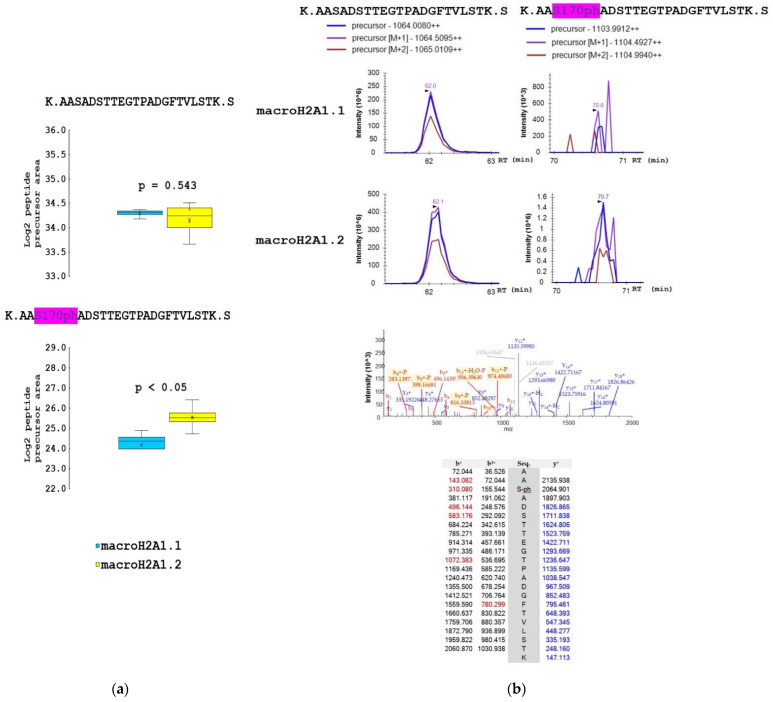
Figure 5.
The proportion of S170ph mark on macroH2A1.1 and macroH2A1.2 protein isoforms in HepG2 cells. (a) Box-plots of the relative abundance of phosphopeptides and corresponding non-modified counterparts showing extremes, interquartile ranges, means, and medians (N = 4). Data were normalized to the sum of selected non-modified peptides to eliminate the effect of different expression levels of the two isoforms during quantitative analyses. Differences between samples in normalized peptide abundances ≥1.5-fold at p < 0.05 were considered as significant. (b) Representative MS extracted ion chromatograms of K.AASADSTTEGTPADGFTVLSTK.S with (m/z 1103.991) and without phosphorylation at S170 (m/z 1064.008), showing their abundance in macroH2A1.1 and macroH2A1.2 isoforms. Representative MS/MS spectrum produced from the precursor ion of m/z 1103.991 and fragments of y- and b-series with the m/z values are shown.

