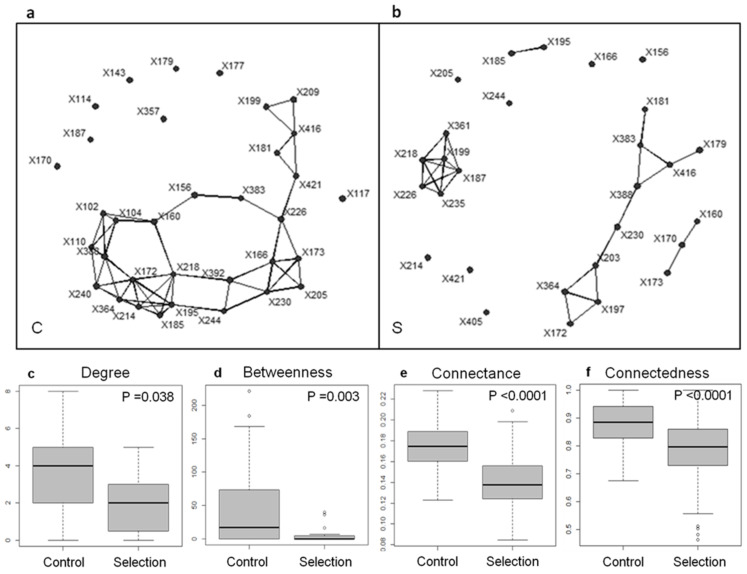
Figure 2.
An example of a network-based analysis of microbiome selection (from [40]). The co-occurrence matrices of the T-RFLP-defined genetic units present after 21 generations were used to build interaction networks for (a) the control (C) and (b) the selection treatment for low CO2 emission (S). When two dots are connected by lines, it means that the abundances of the genetic units were significantly correlated (Spearman correlation coefficient; N = 6; p < 0.05). The interaction networks were used to calculate several network indices (c–f) as follows. The average degree (c) is the average number of interactions engaged in by one genetic unit (equal to 0 for an unconnected unit), providing an estimate of network complexity. The average betweenness (d) is the average number of shorter chains going through one node, which can signal the presence of keystone species in the network. The connectance (e) is the proportion of possible links between species that are actually realized. The connectedness (f) is the probability that at least one chain exists between any pair of units, which quantifies all the direct and indirect interactions within the network. The networks were bootstrapped (200 random samples from each group’s pool of genetic units) to determine (e) average connectance and (f) average connectedness. The values of these indices were compared for the control and selection treatment using Wilcoxon rank-sum tests (employing a continuity correction for non-parametric distributions).

