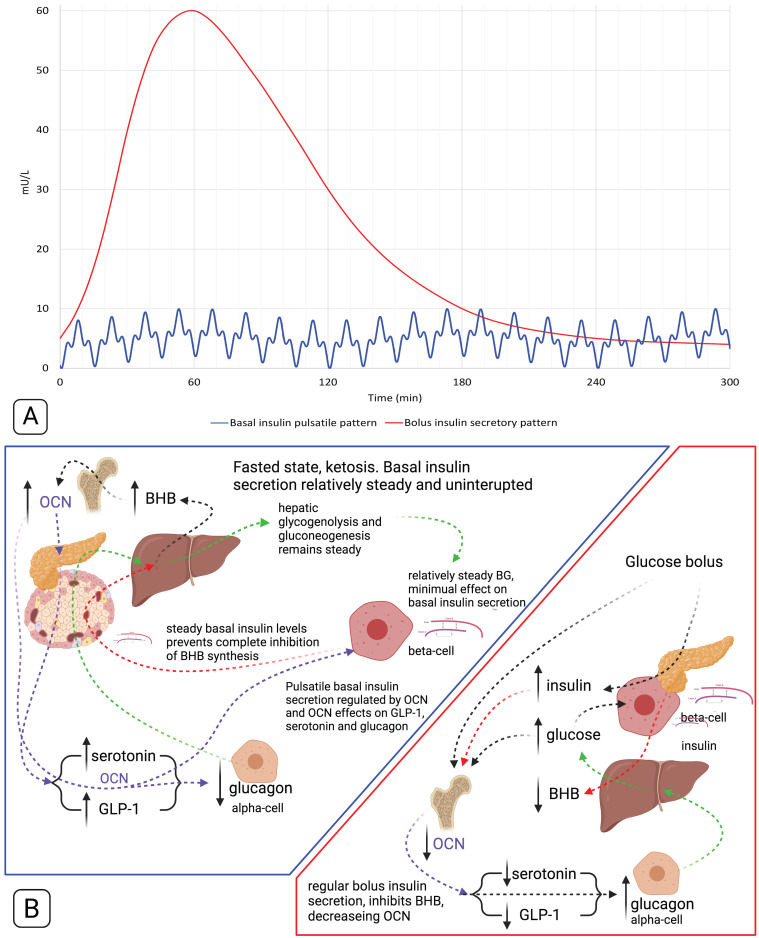
Figure 2.
Schematic representations of basal and bolus insulin secretory patterns (A) and secretion regulation (B). (A) The red line conceptually models glucose bolus mediated insulin secretory response pattern (Kraft I) [36], and the blue line conceptually models basal insulin pulsatile secretory pattern, in metabolically healthy individuals [34]. (B) Schematic representation of the regulatory cycles of basal and bolus insulin secretion in metabolically healthy, habitually fasted individuals. Beta-hydroxybutyrate (BHB), blood glucose (BG), glucagon-like peptide-1 (GLP-1), osteocalcin (OCN).

