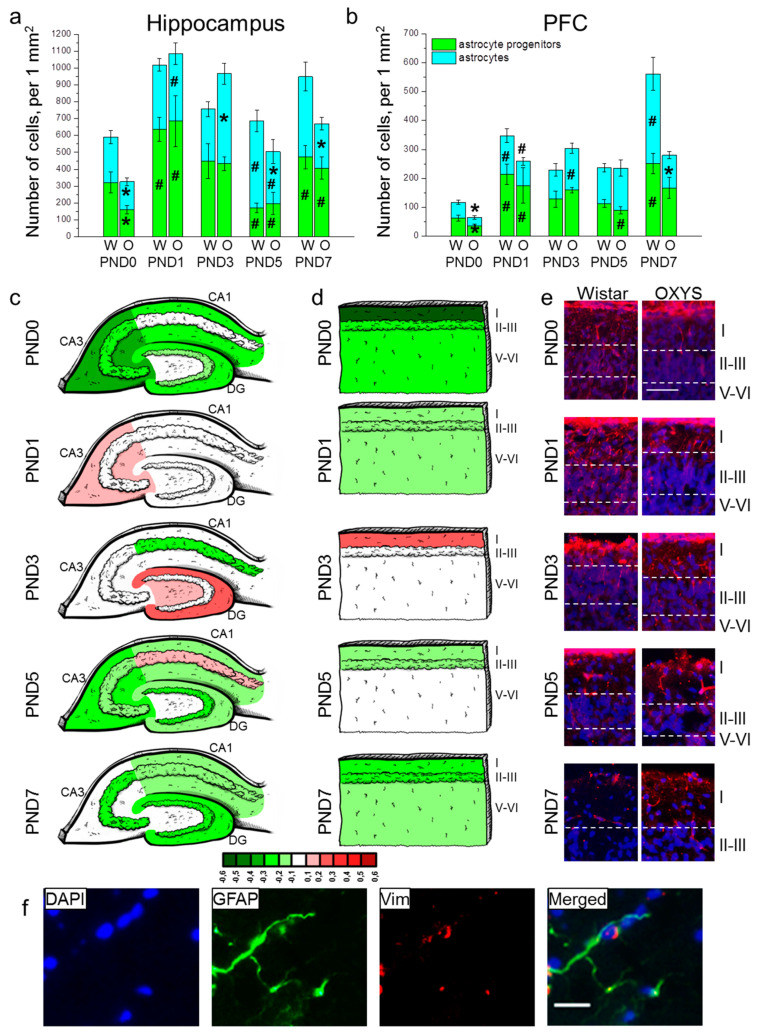
Figure 3.
The density of astrocytes and their progenitors in the hippocampus (a) and PFC (b) of OXYS and Wistar rats during the first postnatal week. Changes in GFAP+ cell density in the regions of hippocampus (c) and layers of PFC (d) of OXYS rats compared to Wistar rats are presented schematically with GFAP+ cell density in each region and layer coded as heatmap with lg scale from −0.6 to 0.6. (e) Vimentin (red)-positive processes of radial glia in the PFC of Wistar and OXYS rats; the scale bar is 50 µm. (f) A representative image of GFAP (green)- and vimentin (red)-positive cells in the hippocampus of a Wistar rat at PND7; the scale bar is 20 µm. DAPI (blue) indicates cell nuclei (e,f). W: Wistar; O: OXYS; I: cortical layer I; II–III: cortical layers II–III; V-VI: cortical layers V–VI; Vim: vimentin. The data (a,b) are presented as mean ± SEM; * p < 0.05 for differences between the strains; # p < 0.05 for differences from a previous time point.

