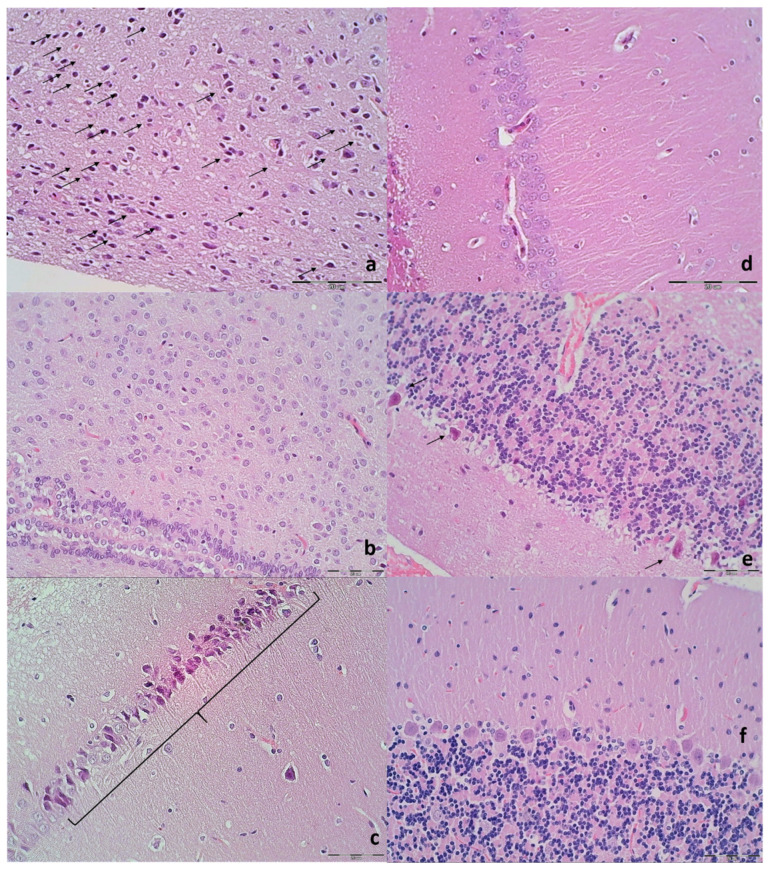
Figure 12.
Illustrative neuropathologic changes in the rat cerebellar cortex, hypothalamus and hippocampus (HE staining). (a) Control showing marked karyopyknosis of hypothalamic neurons (arrows); (b) normal structure of hypothalamus in BPC 157 rats; (c) marked karyopyknosis of pyramidal cells of the hippocampus in control (marked with brace); (d) normal hippocampus in BPC 157 rats; (e) marked karyopyknosis, degeneration (arrows) and loss of Purkinje cells of the cerebellar cortex in control; (f) normal structure of cortex in BPC 157 rats. Magnification ×200 ((a–f); scale bar 20 µm).

